Build and backtest options
The options page is where you build a multi-leg options strategy on BTC or ETH and test it against real Delta India prices. This guide walks you through the chain, building your legs, the stop and target controls, running a backtest, and reading the results.
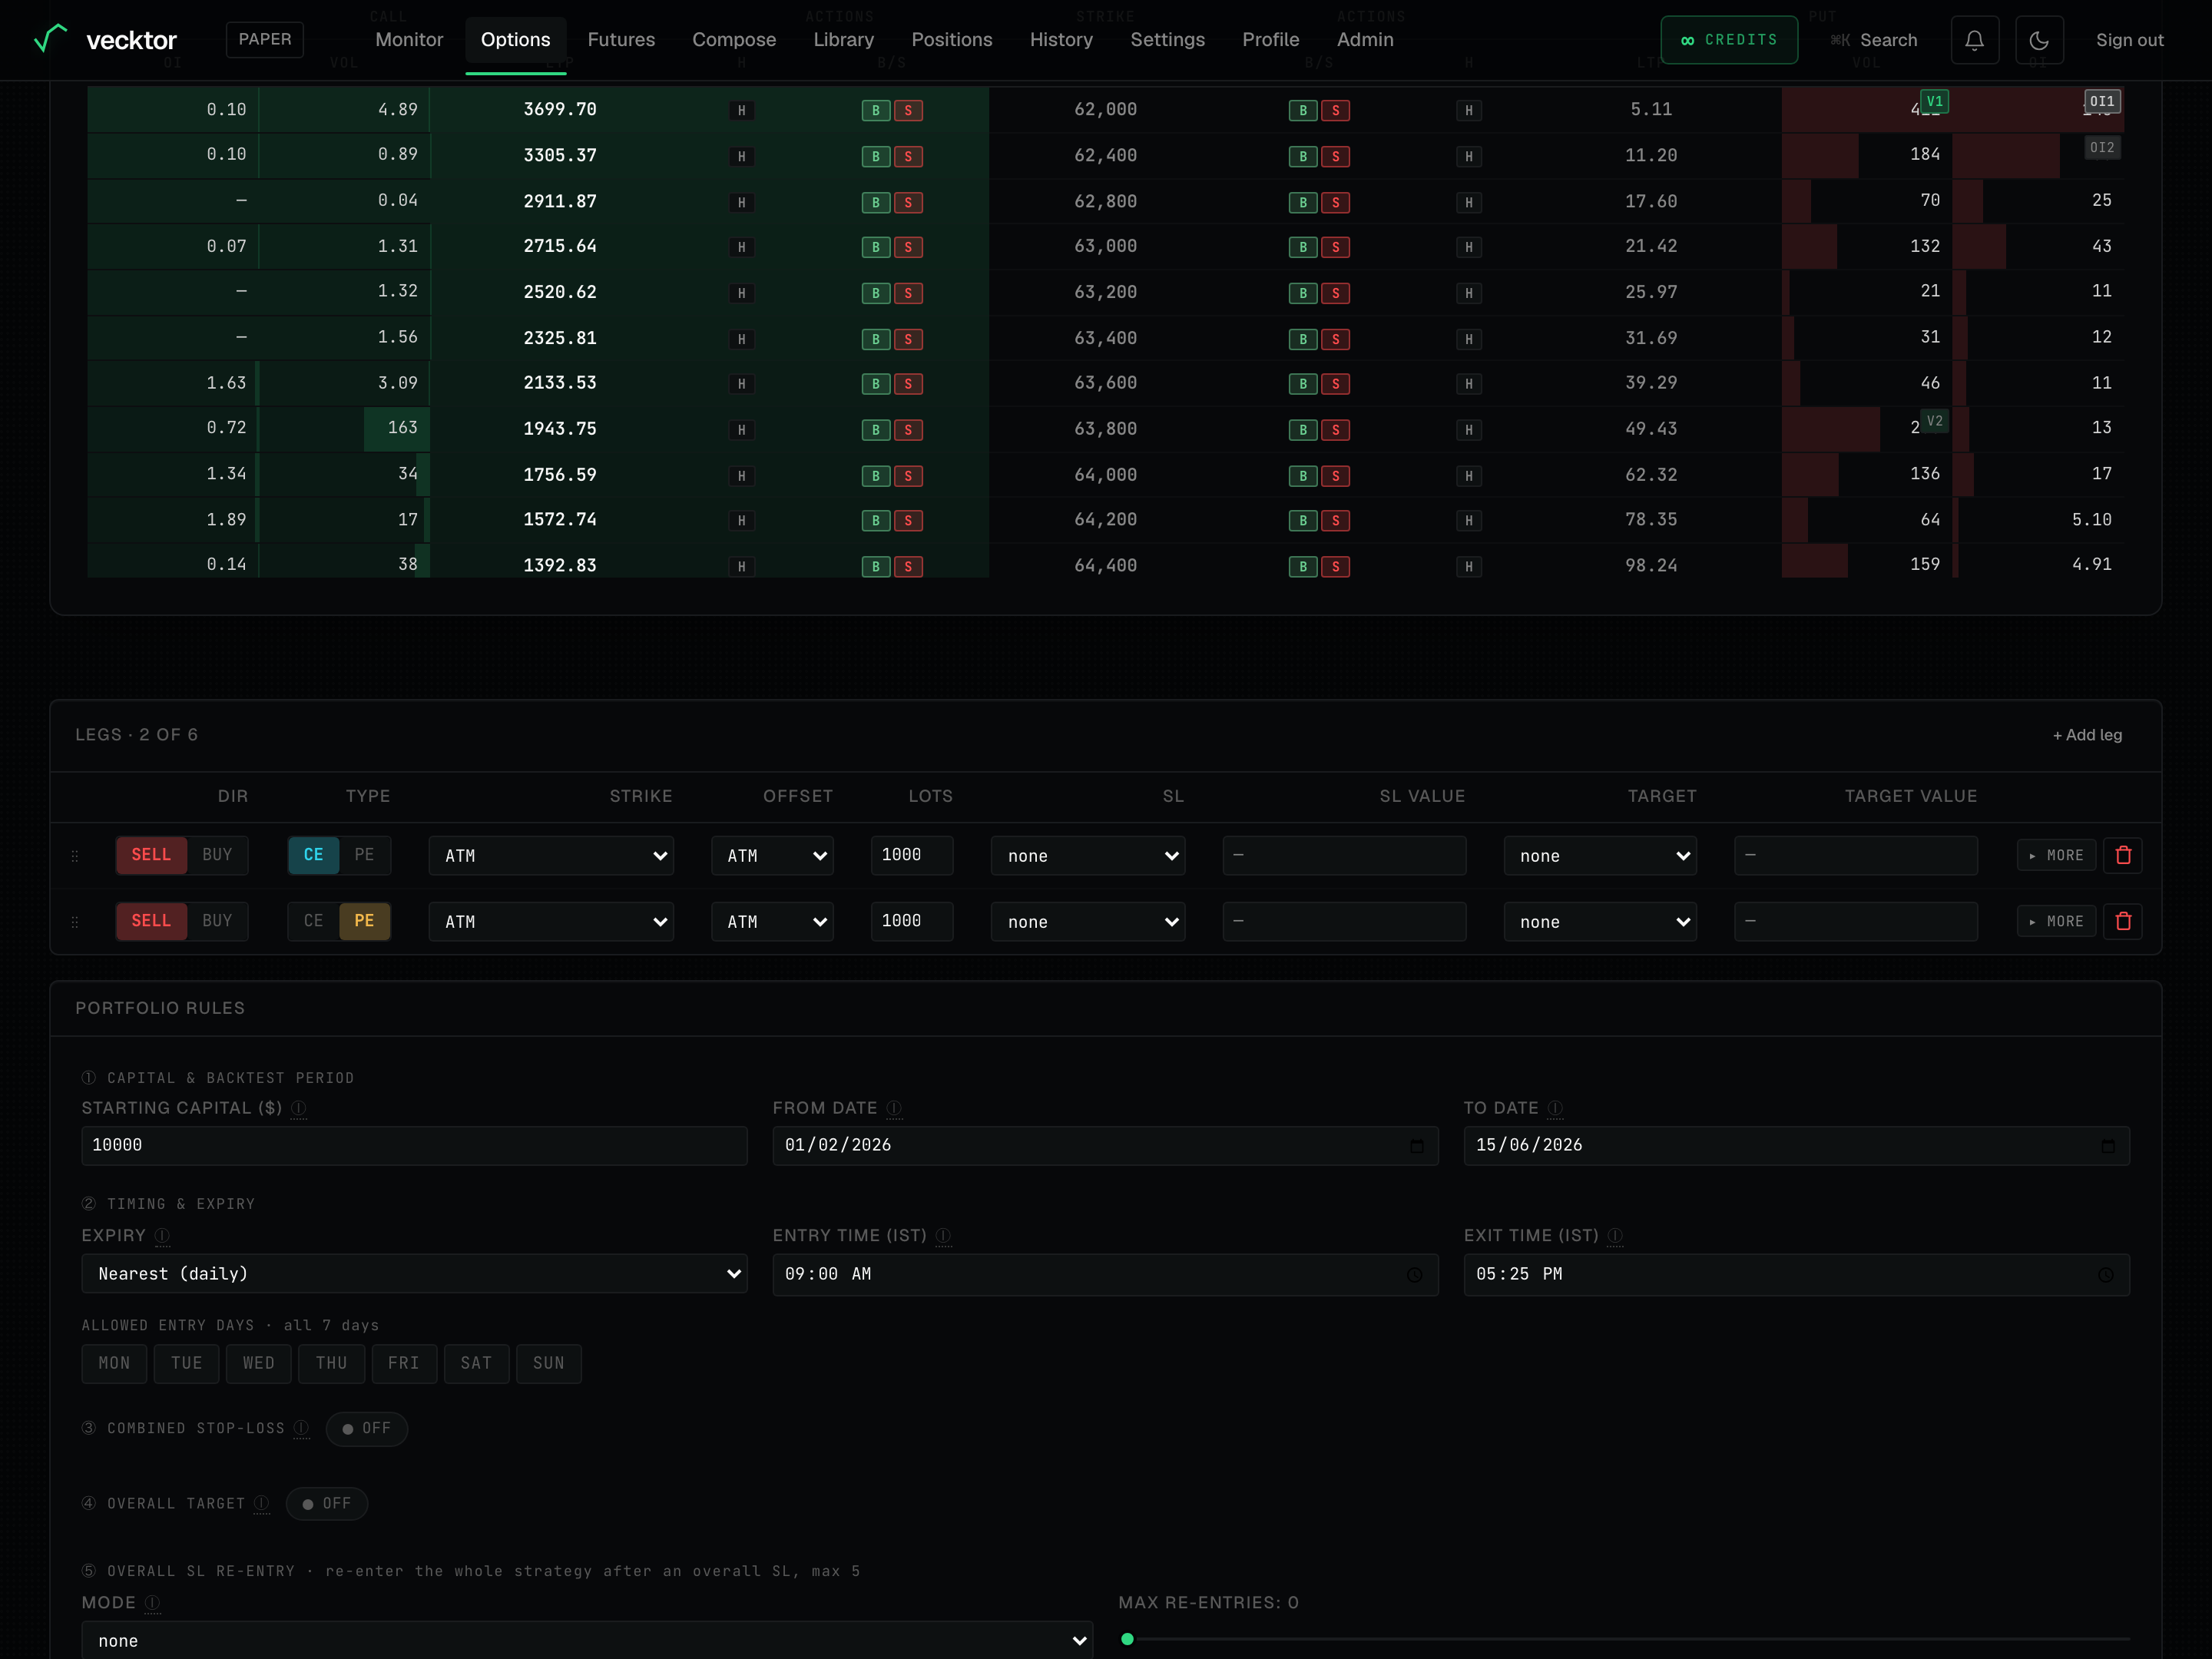
Read the options chain
The chain lists the strikes available for an expiry, with the call side and the put side. Use it to see what is liquid and to add legs by hand.
- Pick BTC or ETH at the top. The spot price (the live index price) shows next to it.
- Choose an expiry from the expiry chips. Closer expiries have more strikes near the money.
- Use the STRIKES filter (±5, ±8, ±10, or ALL) to narrow how many strikes the table shows.
- Read across a row: the STRIKE in the middle, the CALL side (OI, VOL, LTP) on the left, the PUT side on the right.
- In the ACTIONS column, click B to add a buy leg, S to add a sell leg, or H to add a matched hedge leg.
- Top-right of the chain: the BACKTEST / EXECUTION toggle sets what the B/S buttons do. BACKTEST adds the leg to the builder below; EXECUTION places a real order on your connected Delta account (greyed out until keys are connected). The Preferred lots box next to it sets the size. So you can trade straight from the chain.
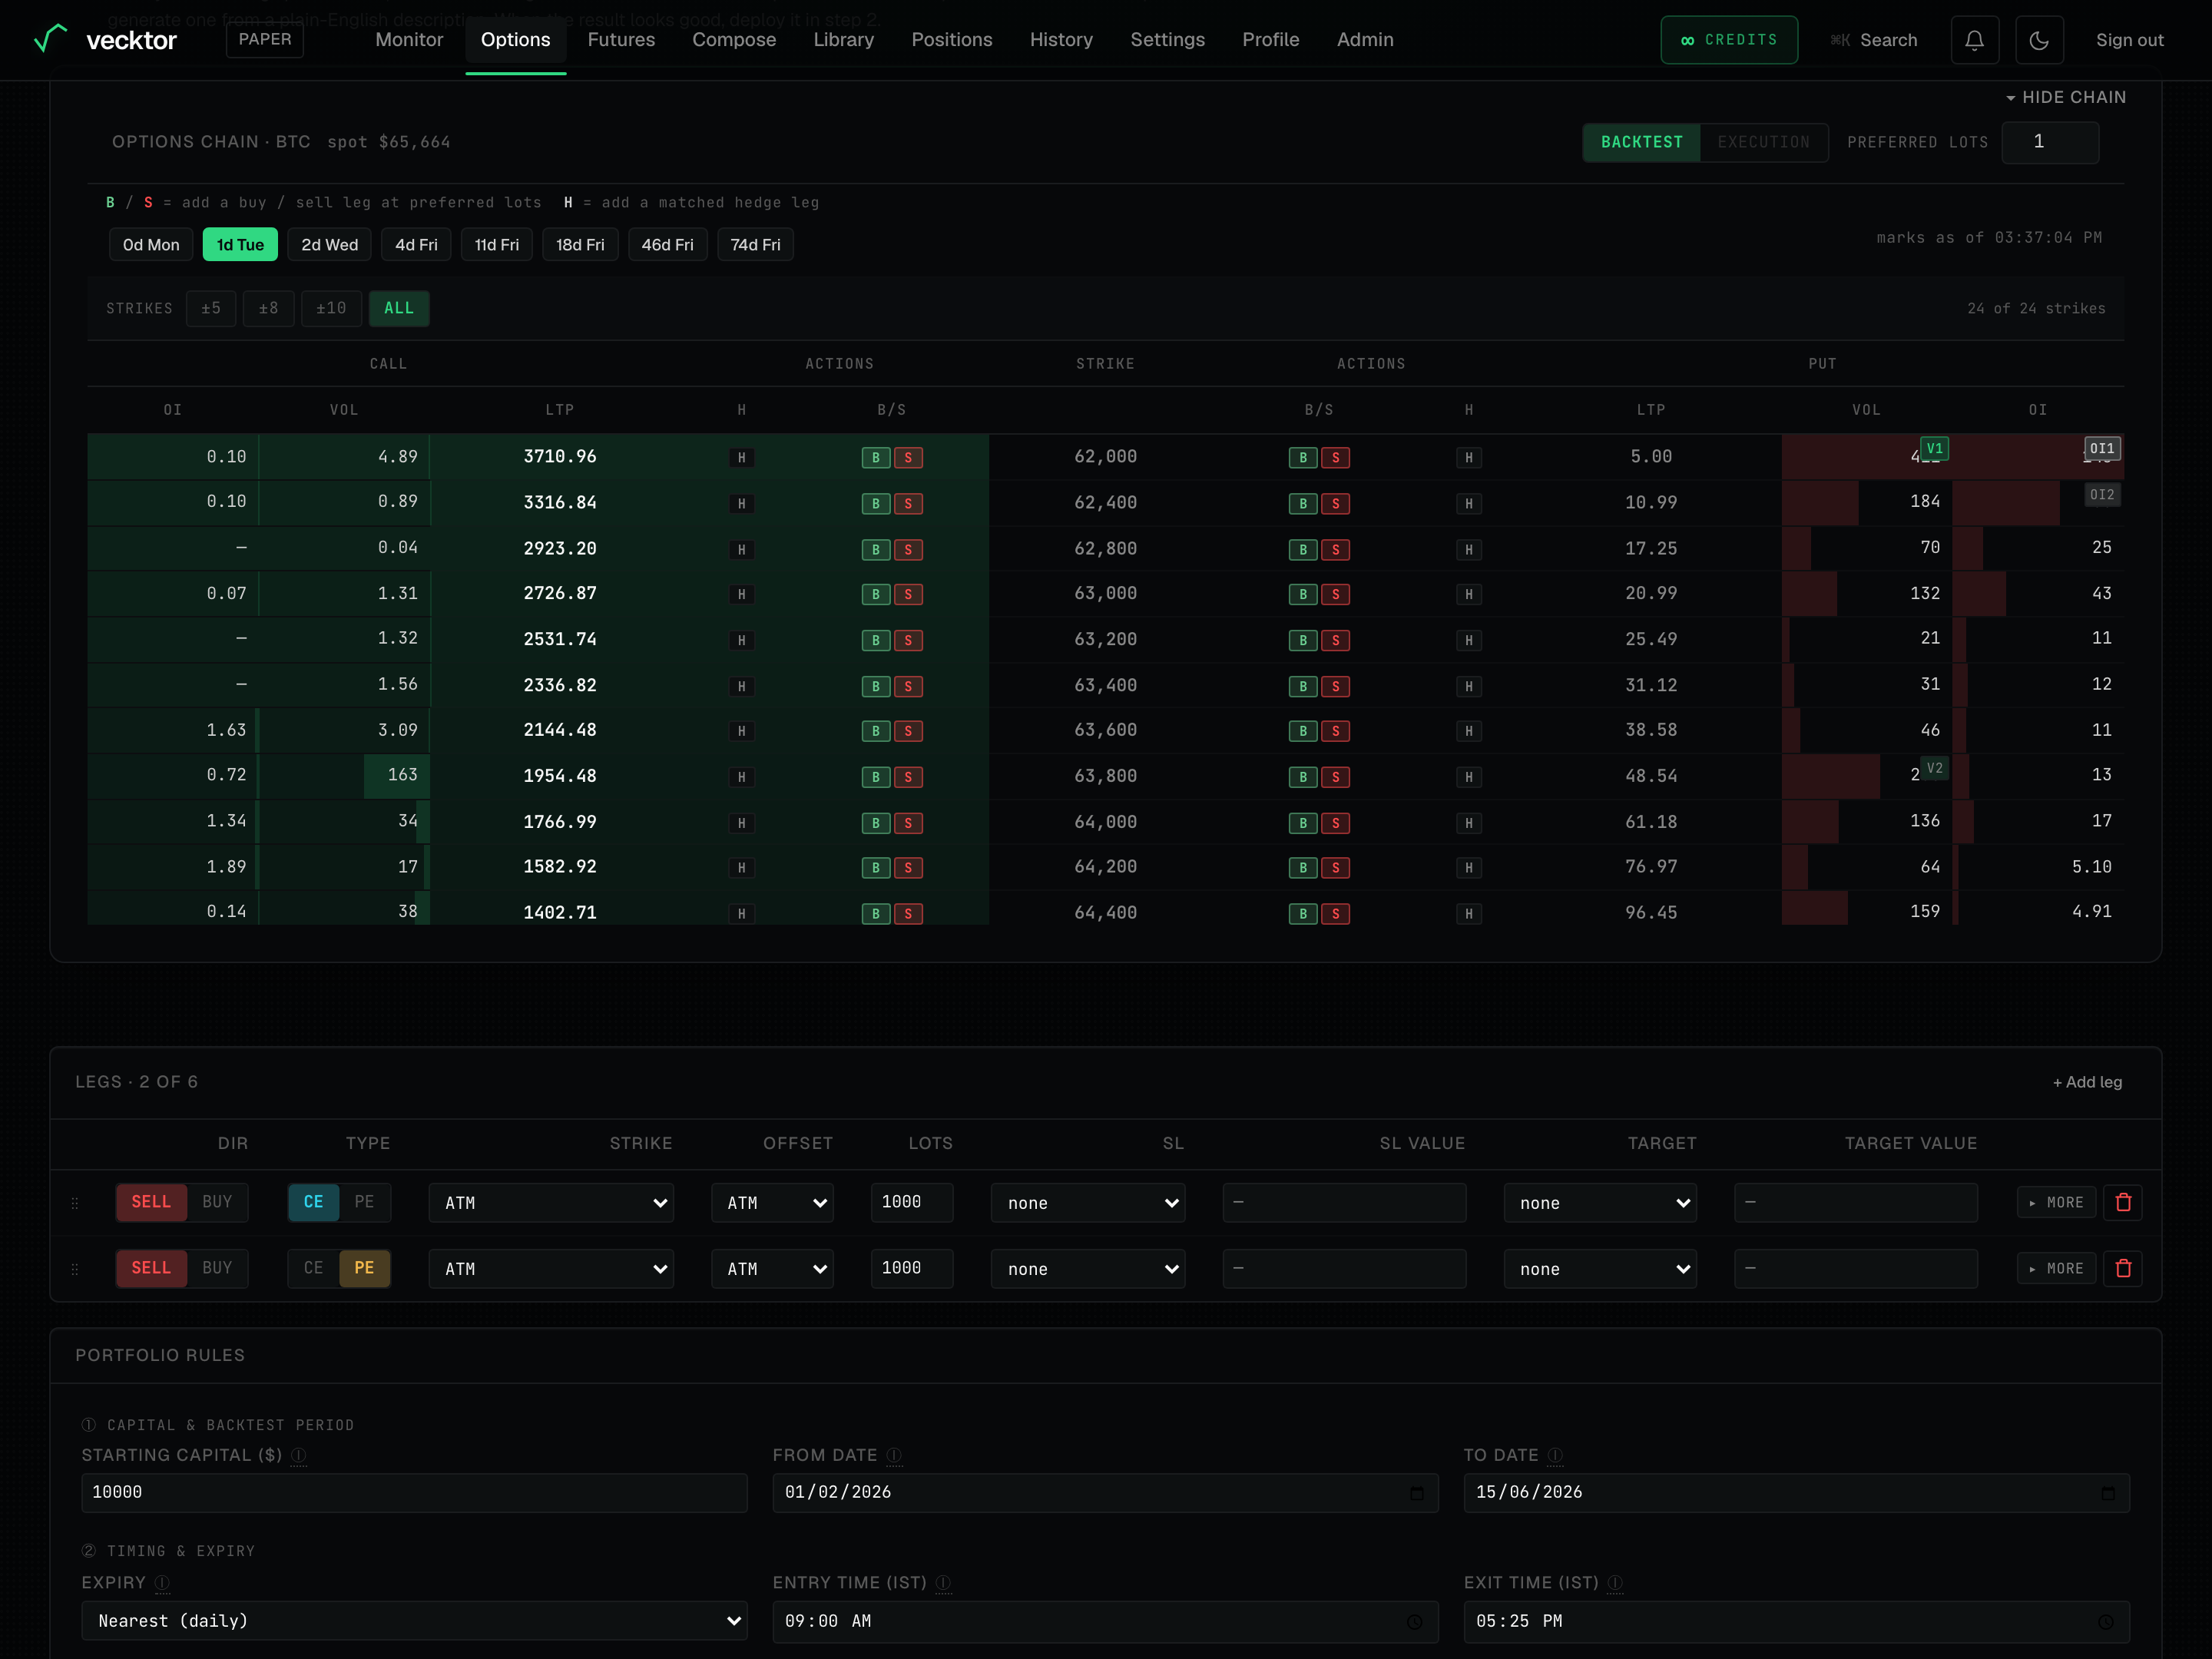 1BACKTEST / EXECUTION: trade straight from the chain2Lots for B / S buttons3Strike-count filter (±5 / ±8 / ±10 / ALL)4Strike price (calls left, puts right)
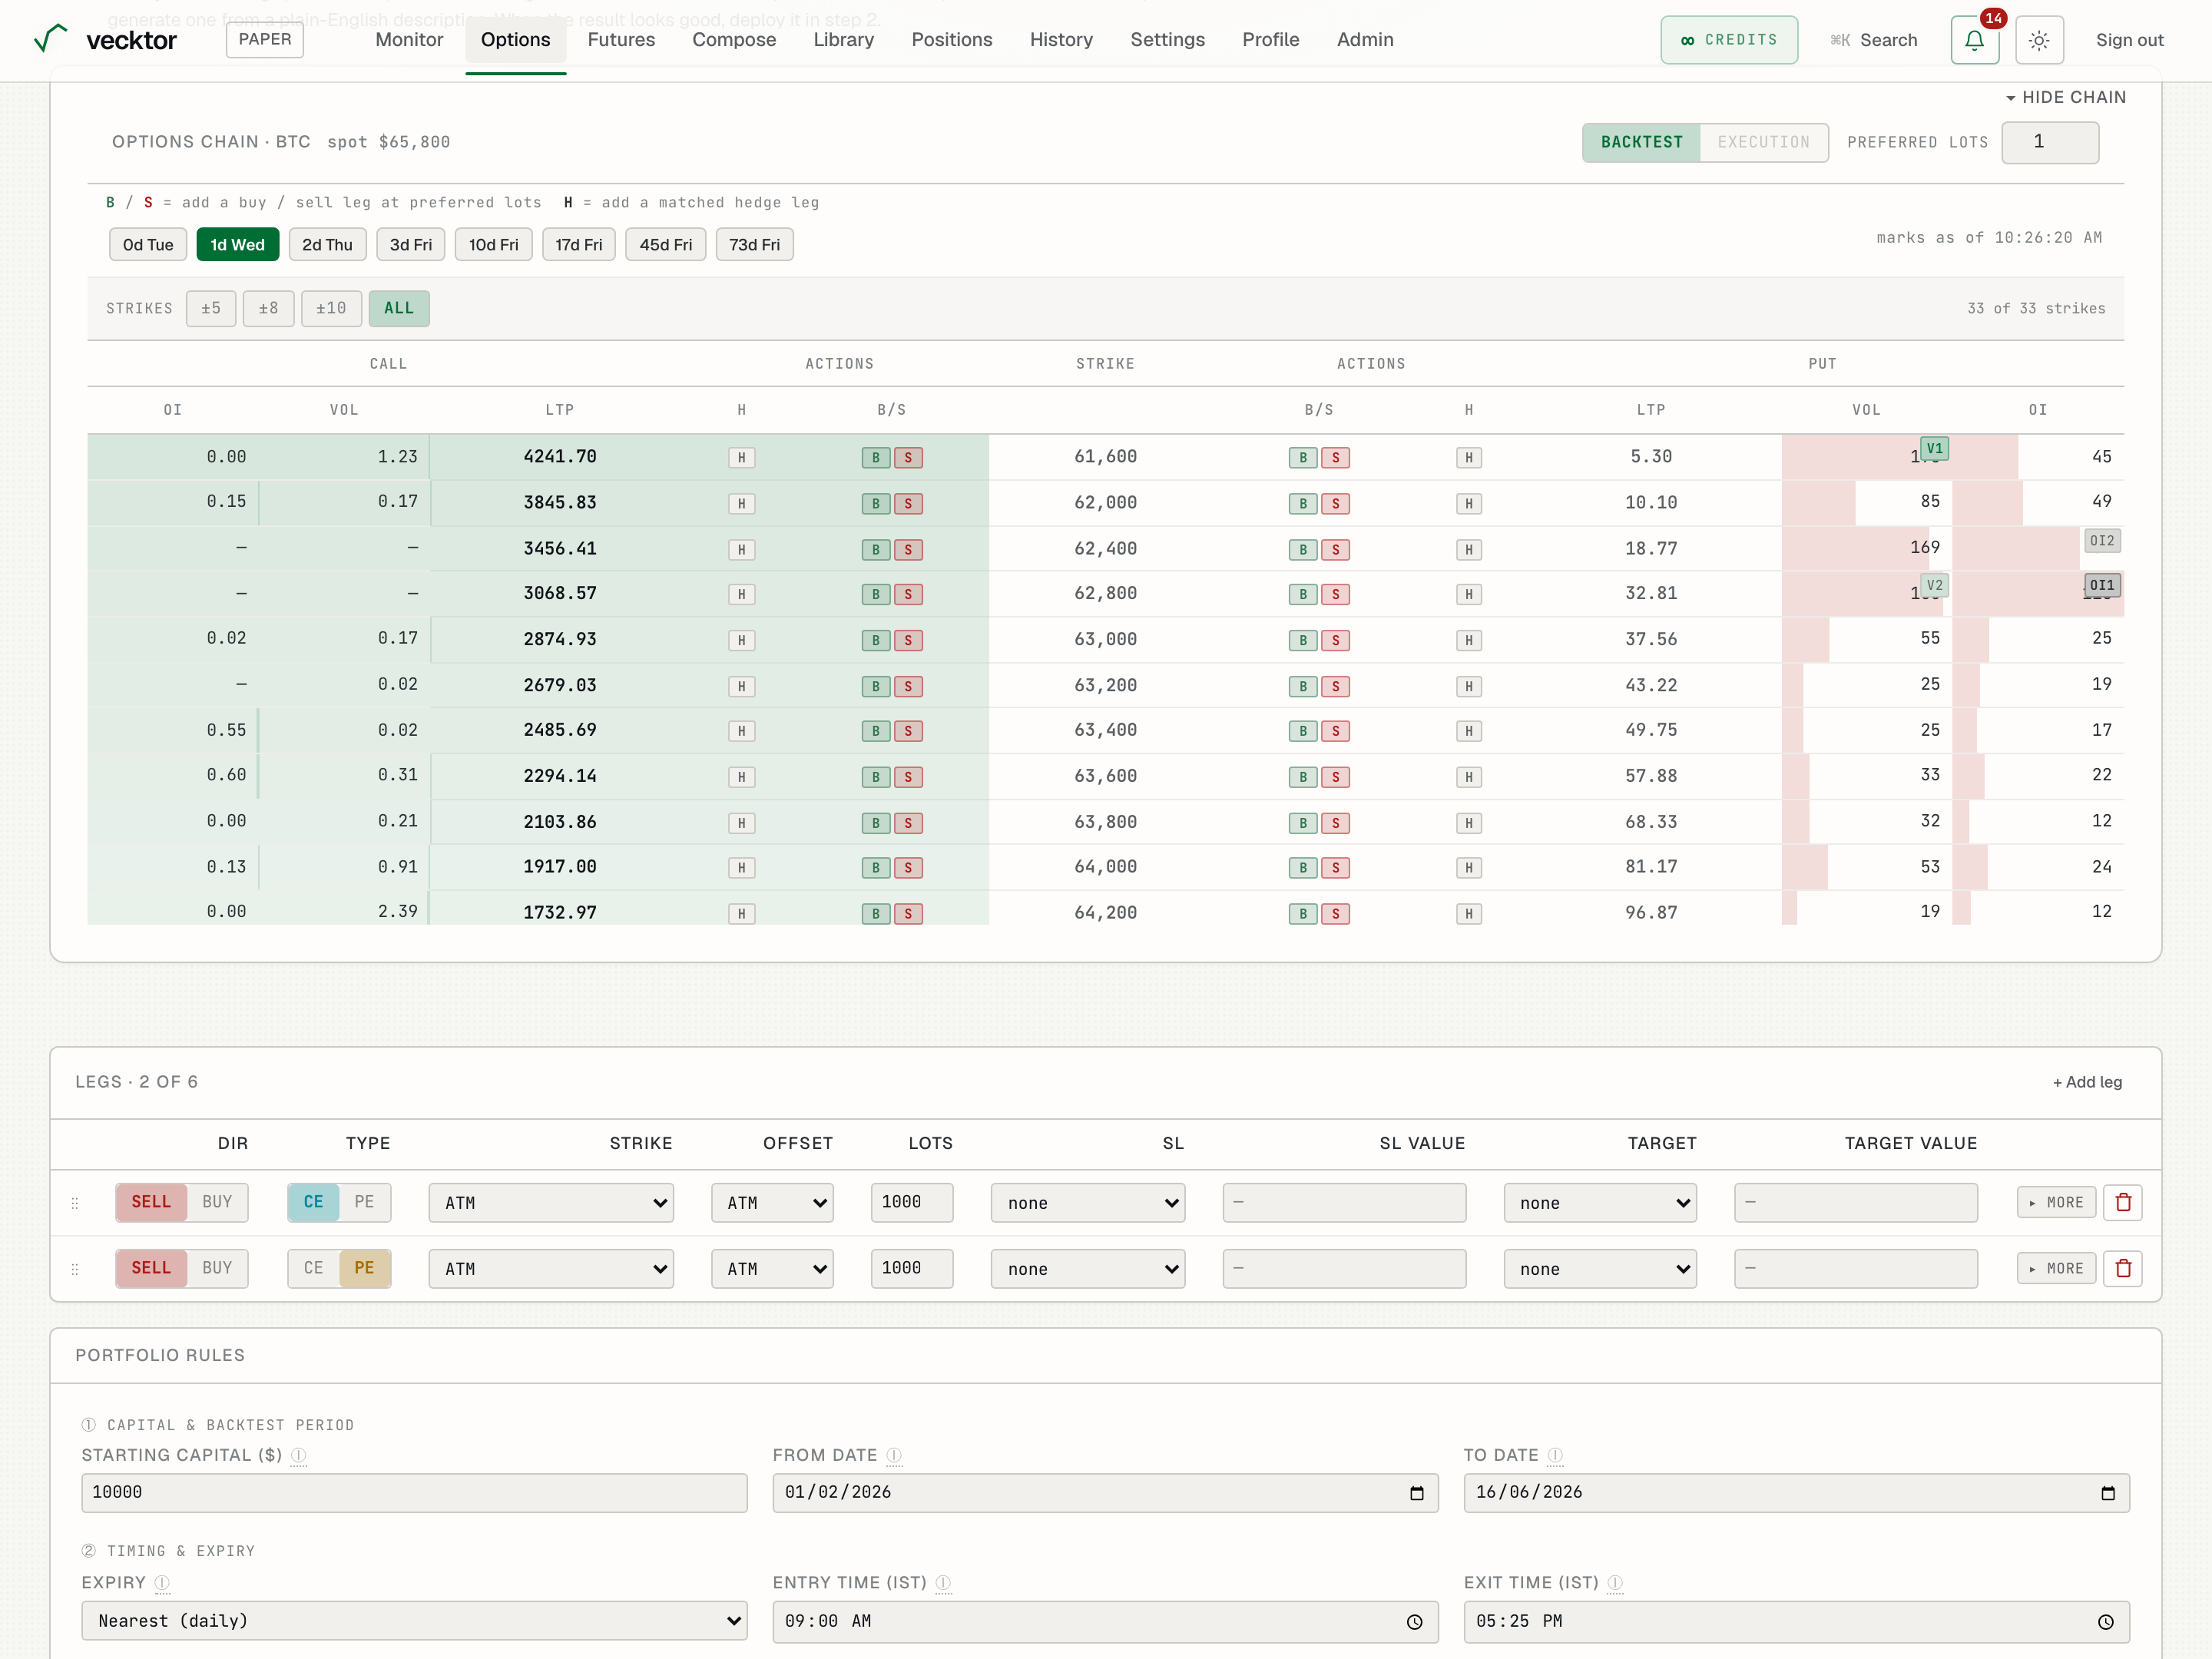
- Pick BTC or ETH (sets the underlying)
- Note the spot price (strikes are relative to this)
- Choose an expiry (nearer expiries list more strikes)
- Find a strike row (call on one side, put on the other)
- Click S to add a sell leg (B buys, S sells, H adds a matched hedge)
Build a multi-leg strategy
A strategy is a set of legs (up to six). Each leg is one option you buy or sell. The leg table is where you shape the whole structure.
- Add legs from the chain, or use a saved preset or template to start from a known structure.
- On each leg row, set DIR (SELL or BUY) and TYPE (CE for a call, PE for a put).
- Set LOTS (your size on that leg).
- Repeat until the structure looks right (up to 6 legs). The exit-condition preview line summarises what will close the trade.
 1Add a leg (up to 6)2DIR: SELL or BUY3TYPE: CE or PE
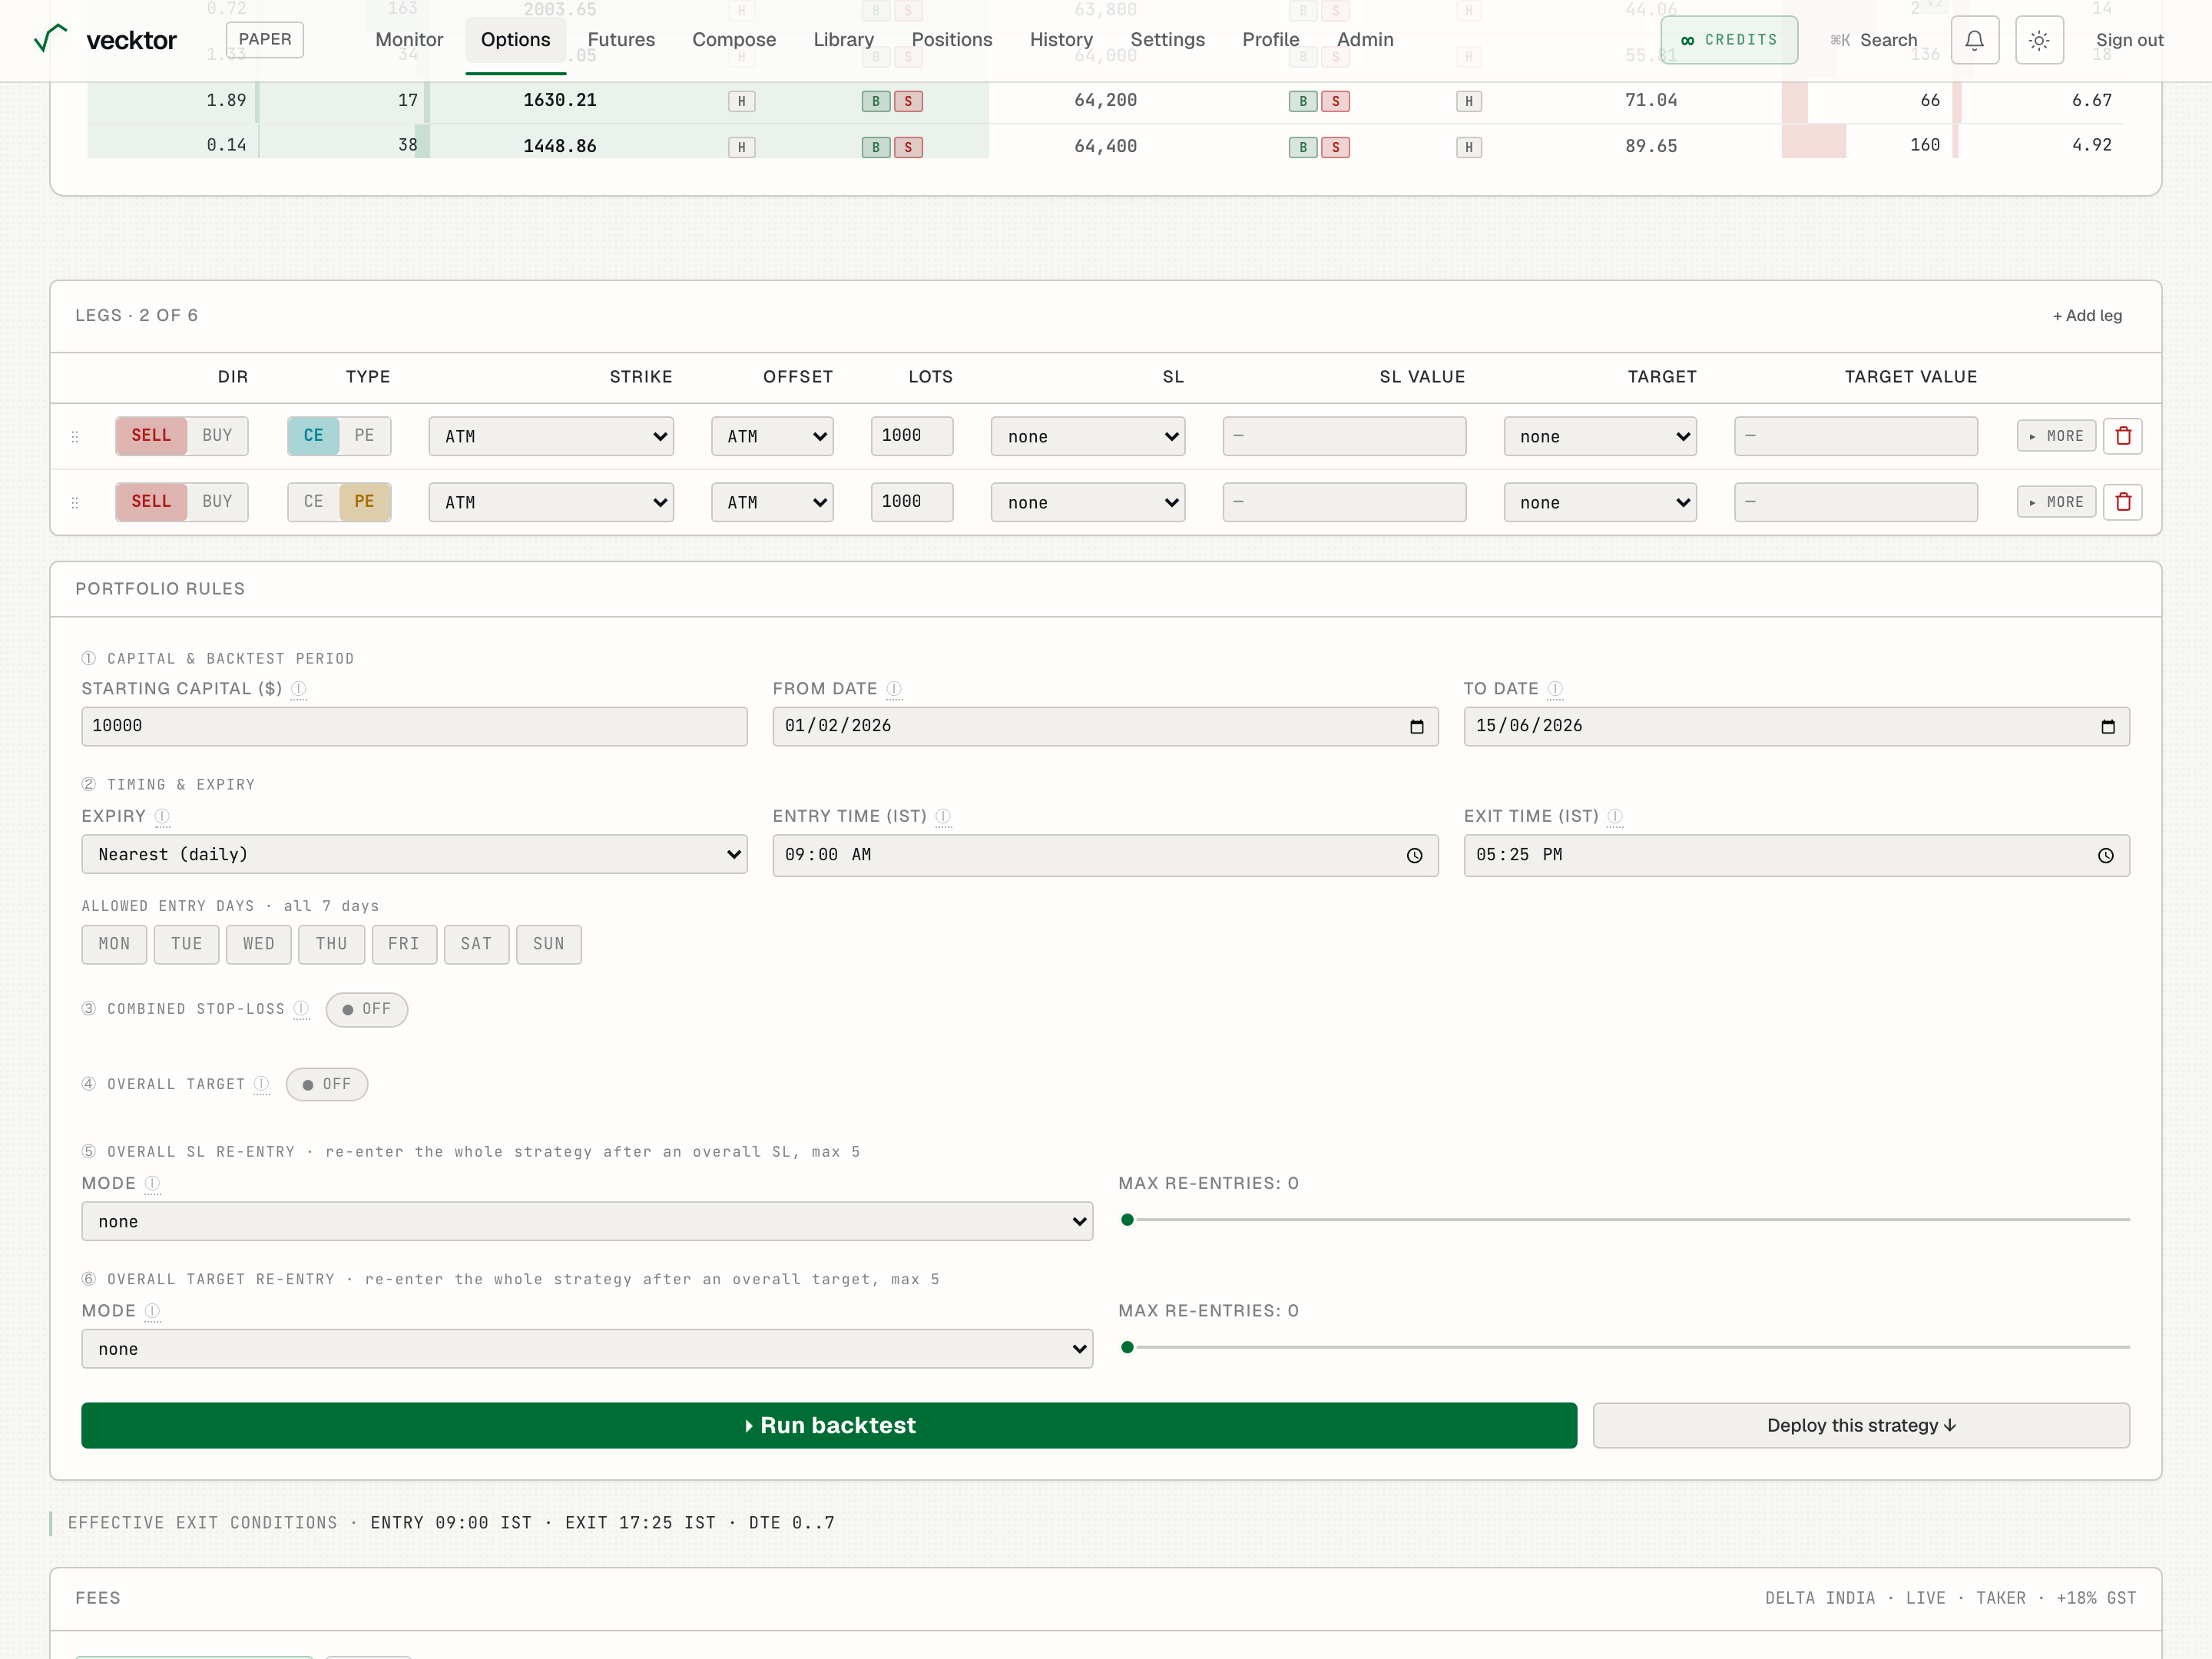
- Set a sell leg (collects premium)
- Add a buy leg to cap risk (this makes it a spread)
- Set the lots (your size on each leg)
- Read the exit preview (what will close the trade)
Choose how each leg's strike is set (the Strike column)
Instead of pinning a fixed strike, the Strike column tells each leg how to pick its strike every time it enters. This keeps a strategy relative to the market as spot moves. The dropdown has three groups: Strike, Premium, and Delta.
- Open the Strike dropdown on a leg.
- Strike group: ATM (at the money) picks the strike nearest spot.
- Premium group: Closest premium, Premium range, Premium ≥, or Premium ≤ pick by the option's price (its mark).
- Delta group: Closest delta or Delta range pick by the option's delta (how much it moves per $1 of spot, from 0 to 1).
- Set the OFFSET column next to it. For ATM the offset steps the strike OTM (further out) or ITM (deeper in); for premium and delta methods the offset is ignored and you set the target in the leg's expand row.
 1Strike method (Strike / Premium / Delta)2OFFSET: the step or value
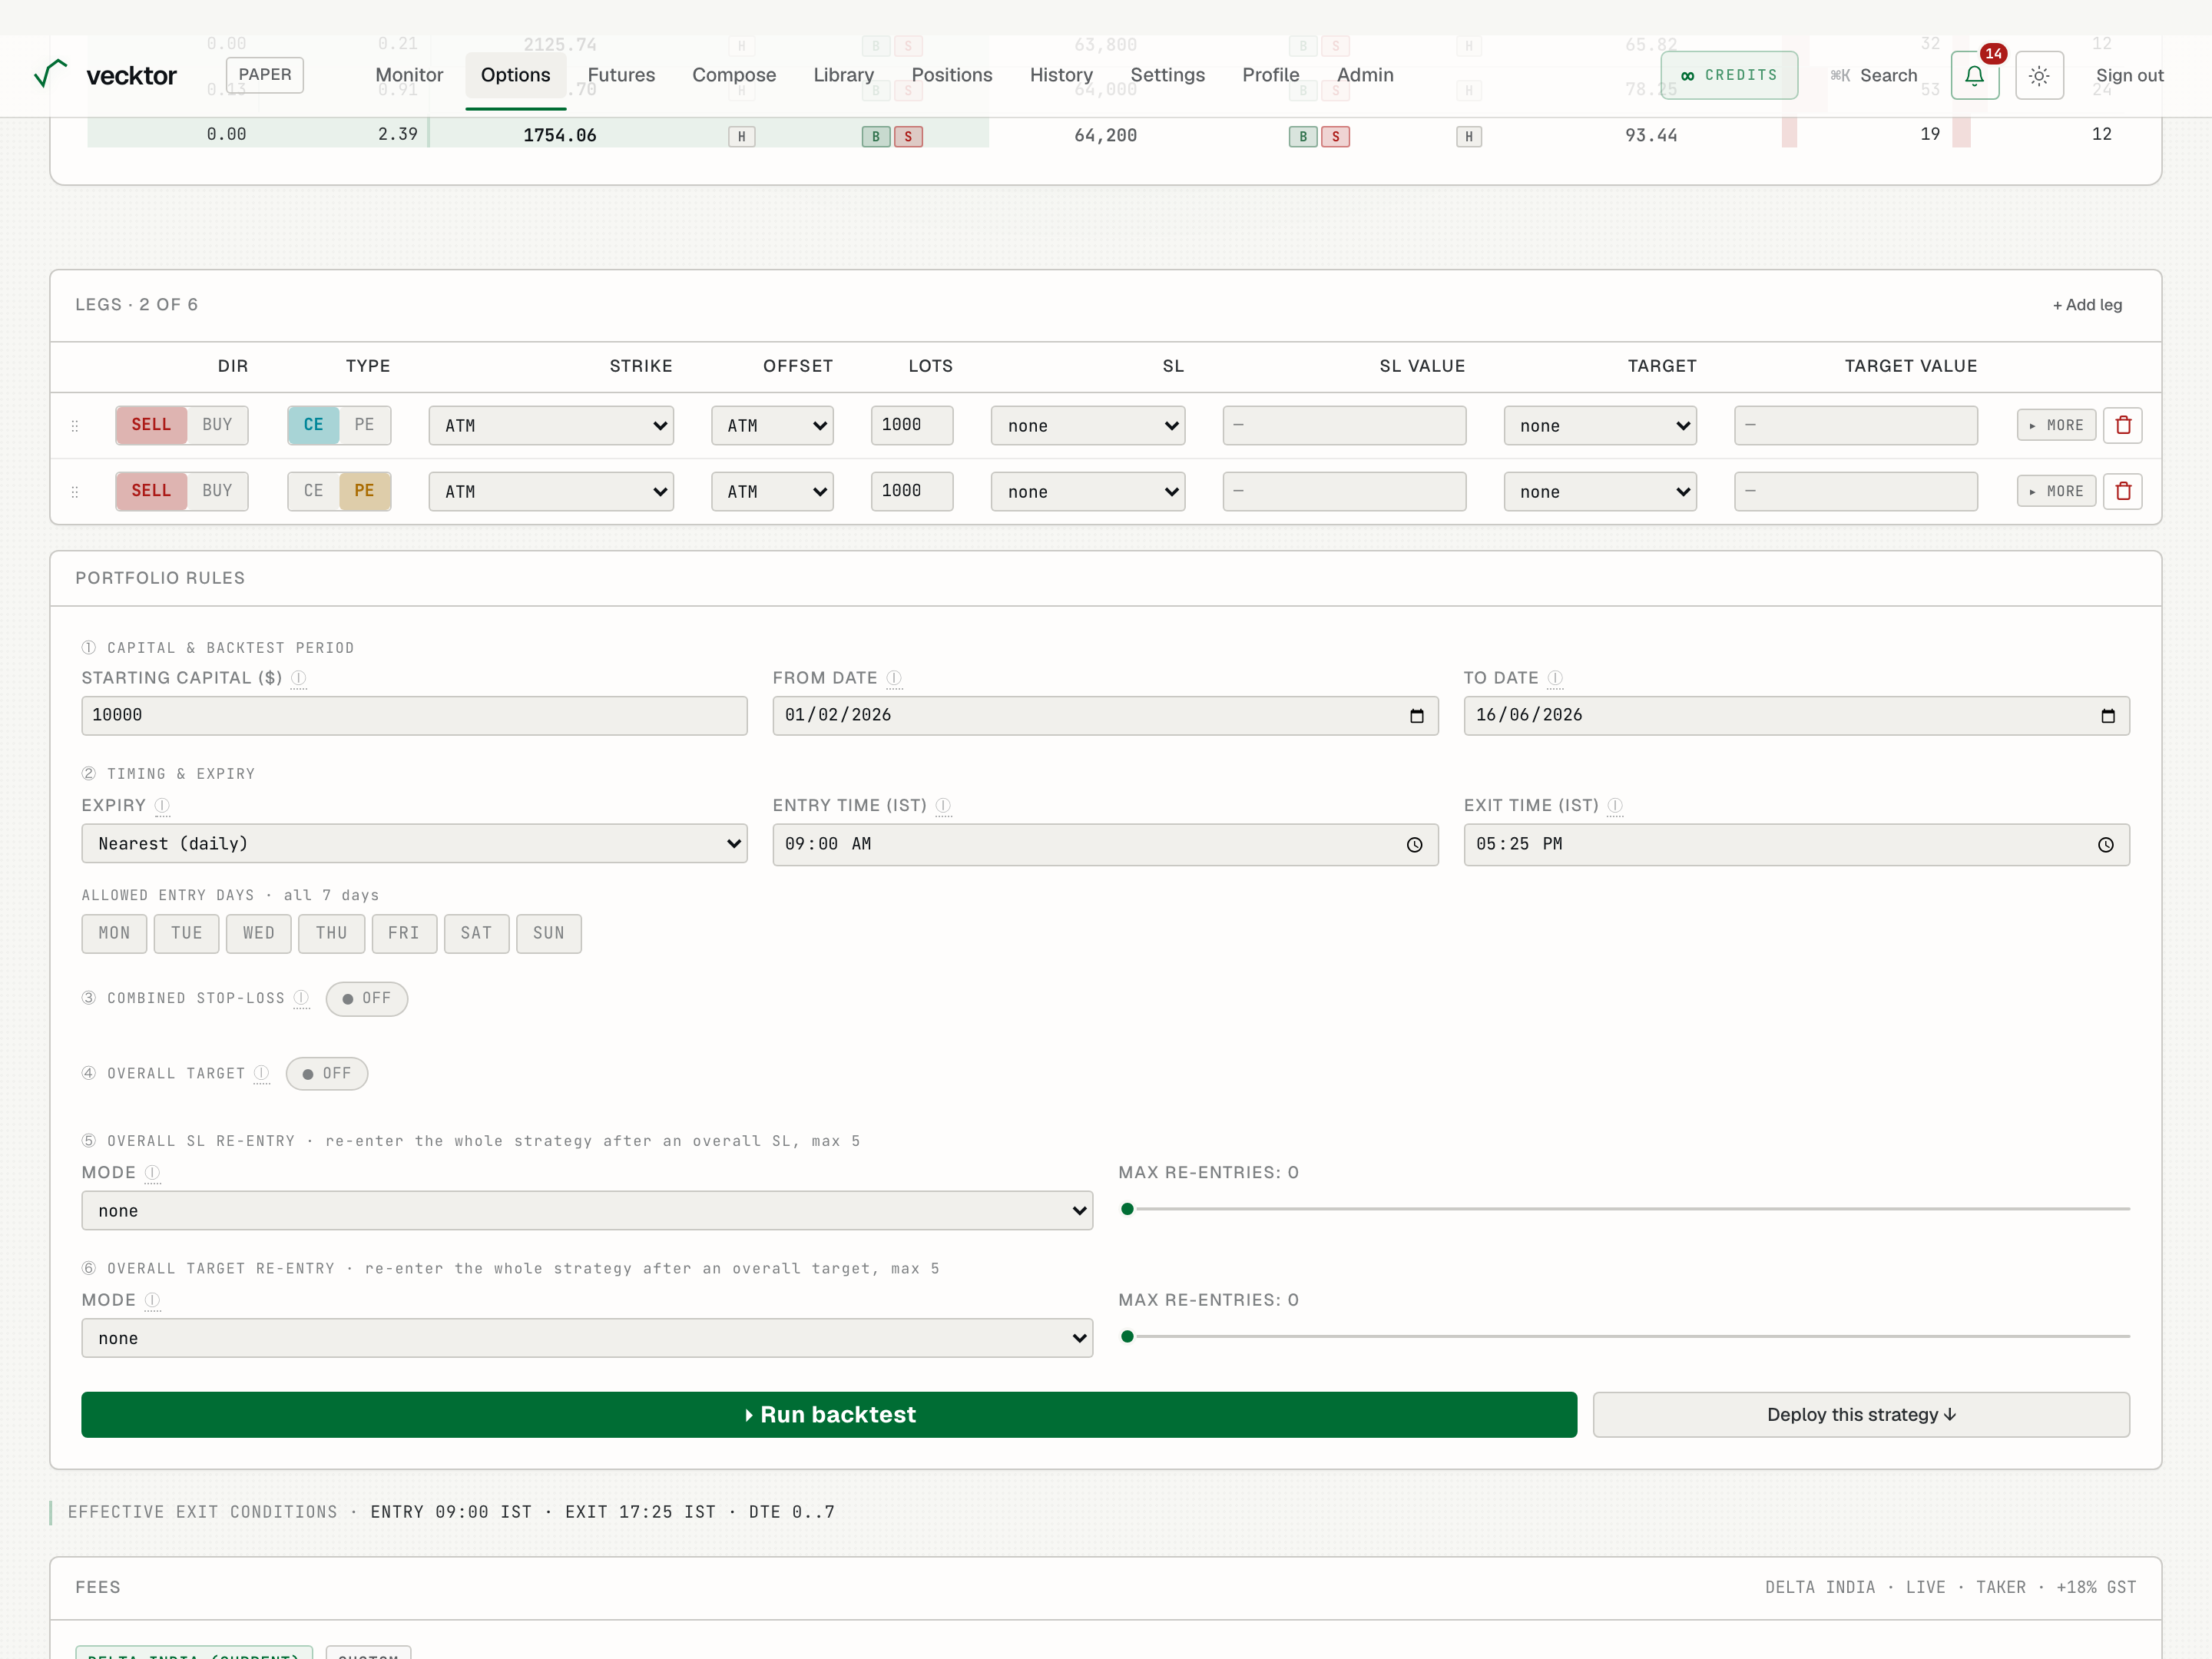
- Strike group: ATM picks nearest spot
- Premium group: pick by the option's price (good for selling)
- Delta group: pick by the option's delta (e.g. the 0.25 delta strike)
- Set the OFFSET (for ATM it steps out (OTM) or in (ITM))
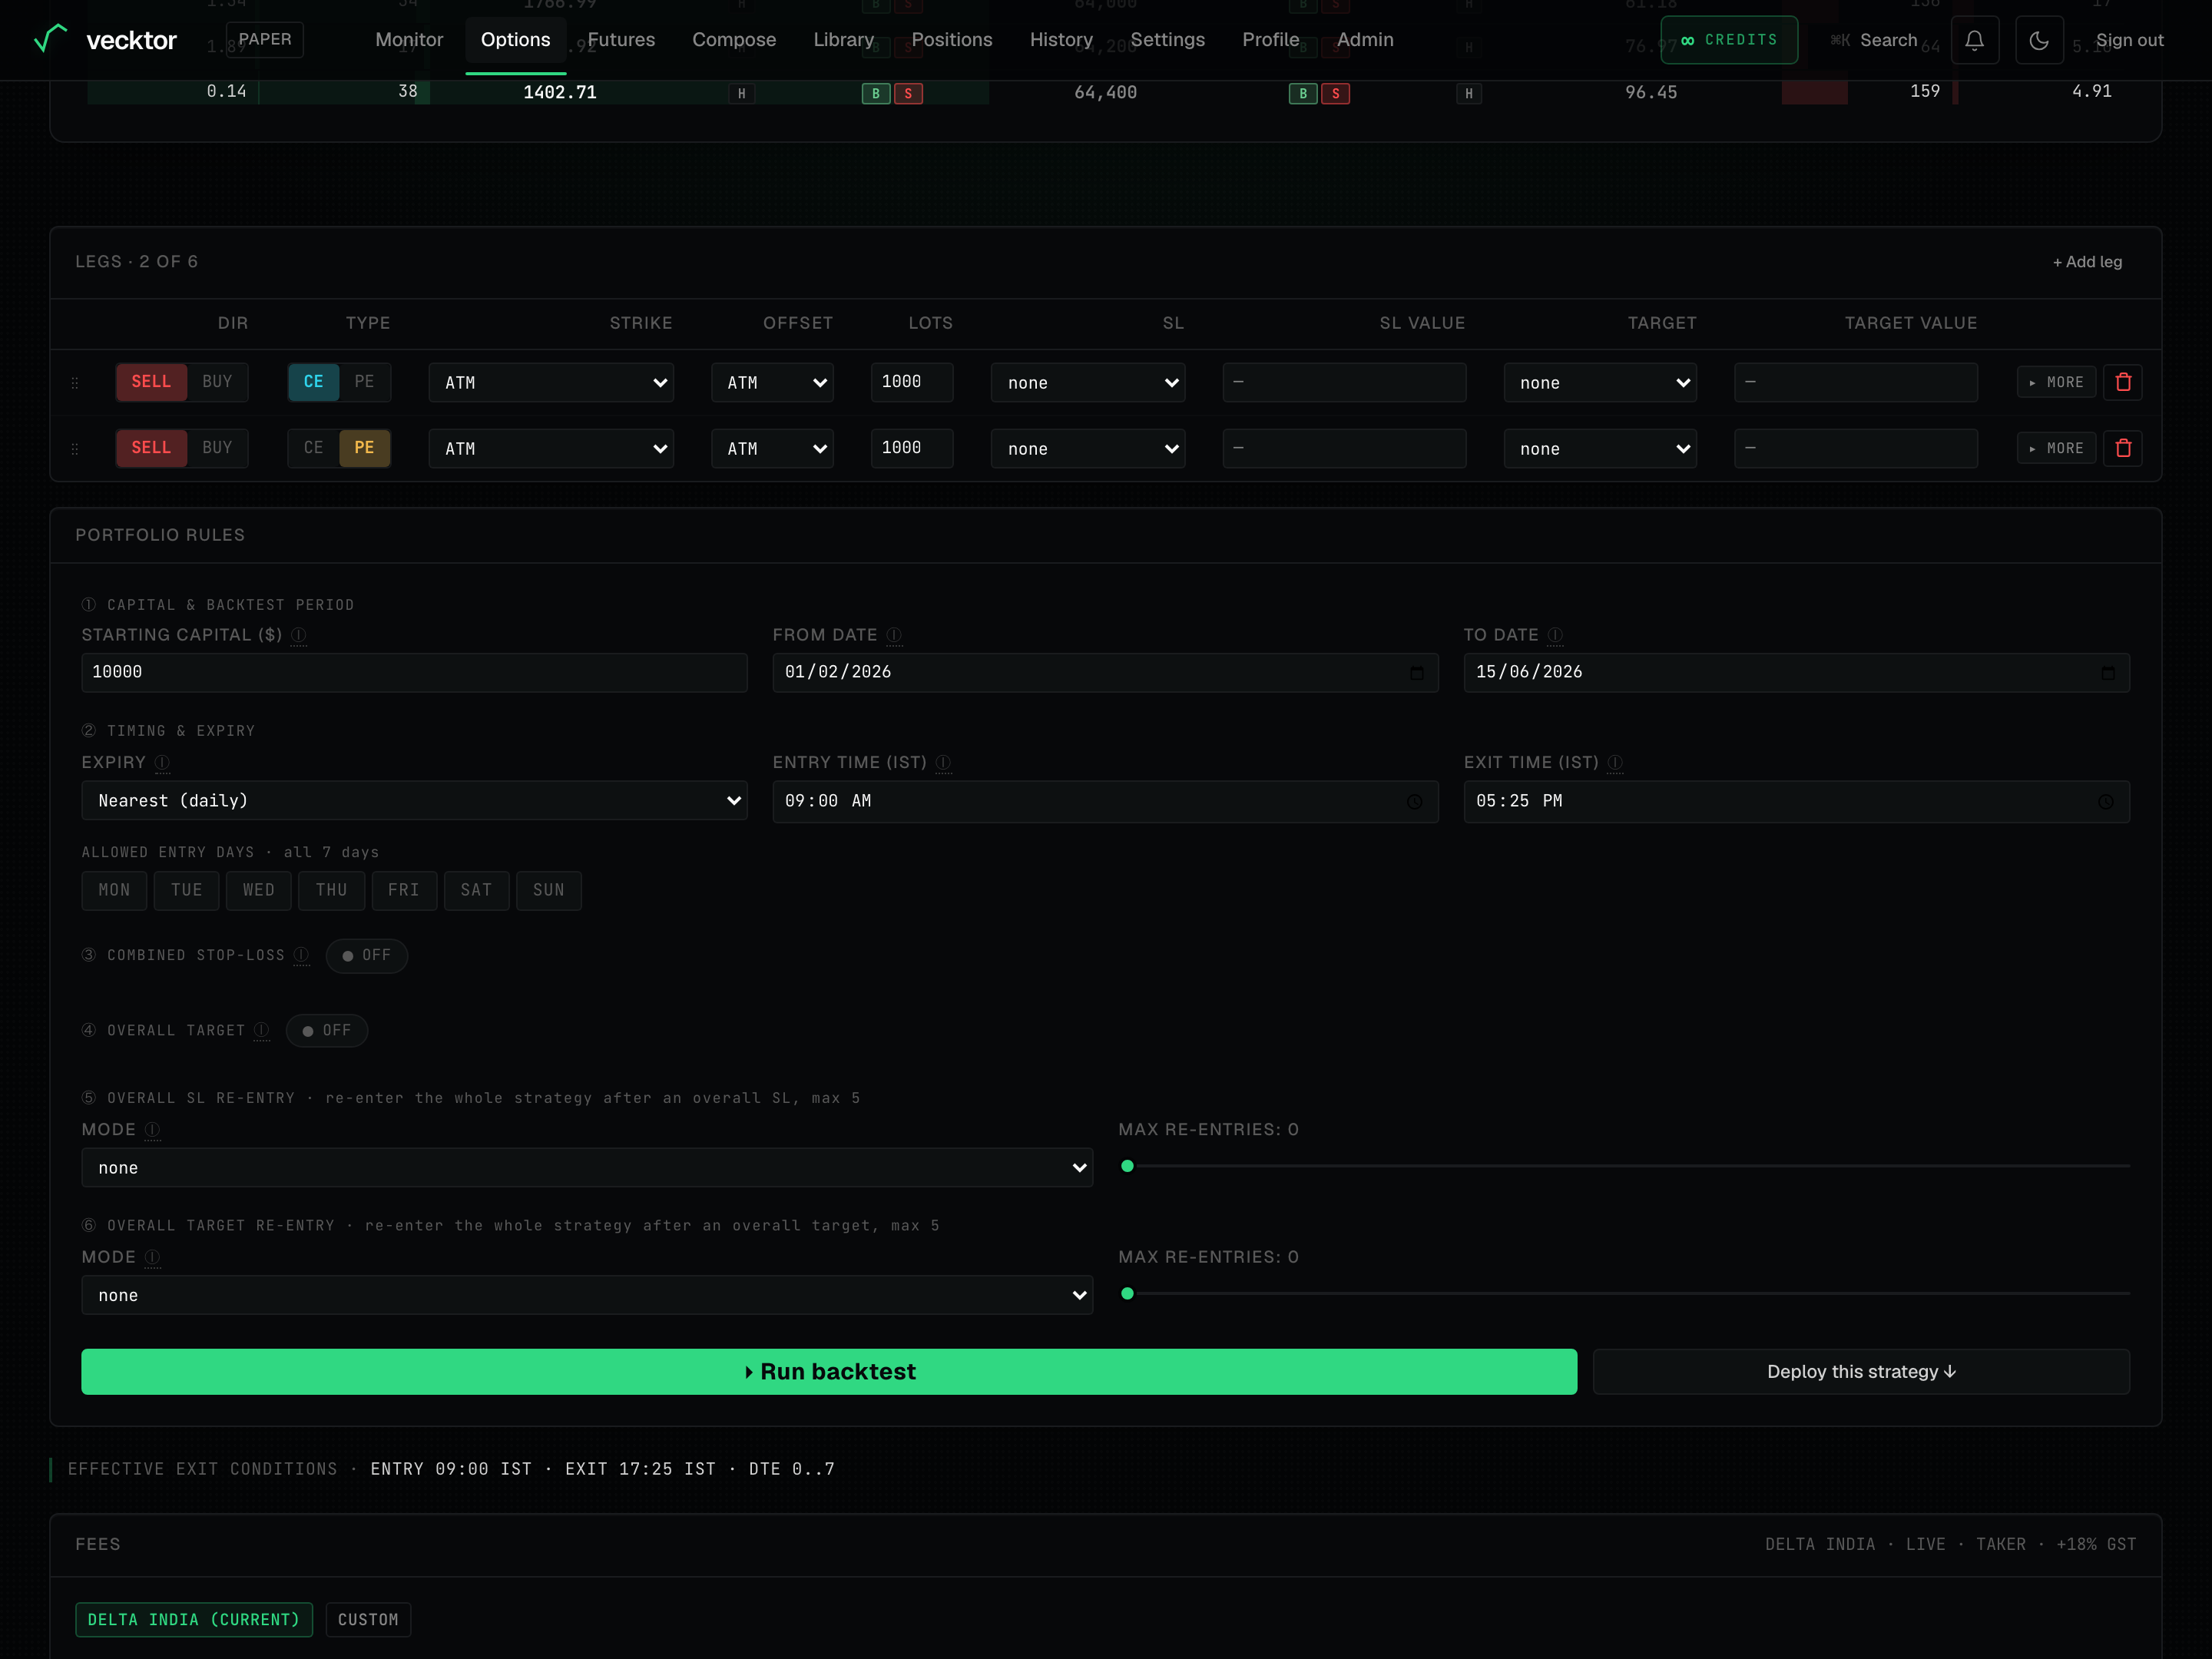
Set per-leg stops and targets
Each leg can have its own stop loss and target, set in the leg table's SL / SL VALUE / TARGET / TARGET VALUE columns.
- In the SL column, pick what the stop measures: Points or % (both on the option's own premium), or Underlying pts / Underlying % (on spot). Put the number in SL VALUE.
- In the TARGET column, do the same for the profit target, with the number in TARGET VALUE.
- Leave a column blank for no per-leg stop or target there (the whole-strategy rules below still apply).
 1Per-leg stop loss2Per-leg target
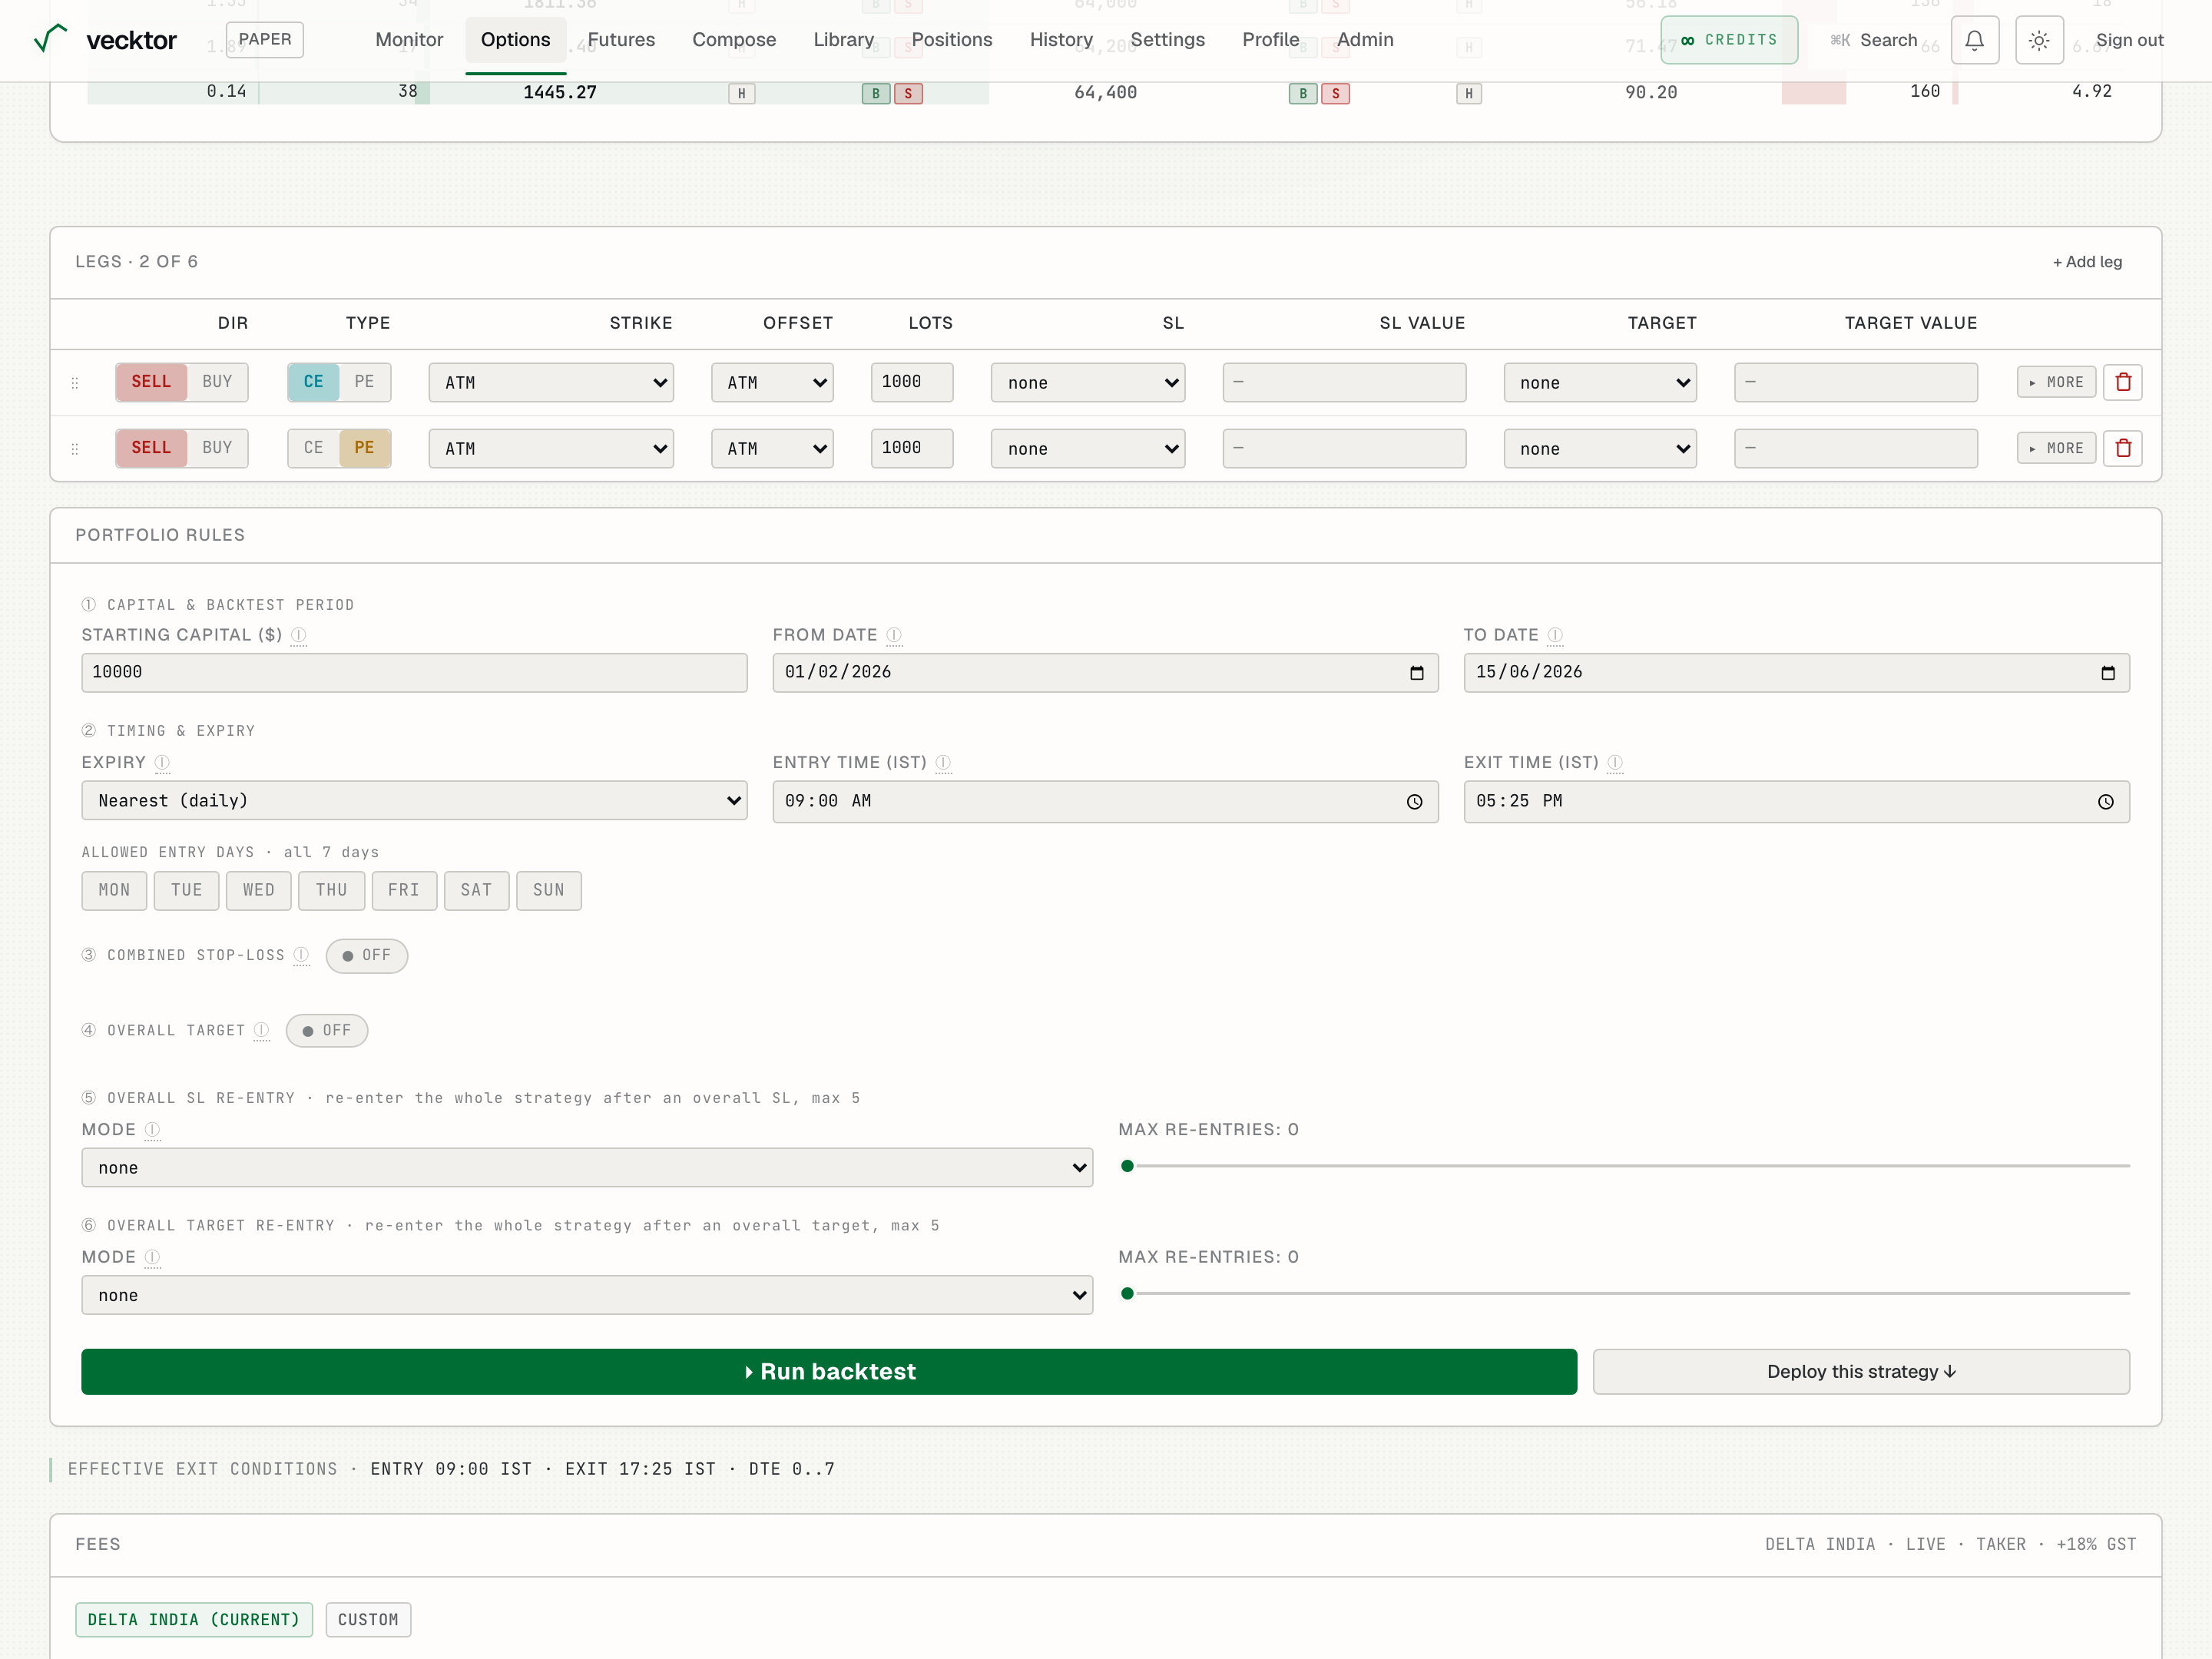
Trailing stop and re-entry (click MORE on a leg)
Click MORE on a leg row to expand its advanced controls: a trailing stop, re-entry, and a momentum entry gate. These apply to that one leg.
- Trailing stop: set UNIT (points or %), IF IT MOVES (X) and TIGHTEN SL BY (Y). Each time the leg gains X in your favour, the stop tightens by Y in the same direction, locking in profit as it runs.
- Re-entry on stop-loss / on target: choose a MODE for what happens after that leg's stop or target fires. Instant re-enters the same leg immediately; At Entry Price waits until the premium returns to your entry; On Momentum waits for the momentum trigger; the Flip ⇄ variants re-enter on the opposite side. MAX caps how many times.
- Momentum entry (optional): hold this leg's first entry until spot or the premium moves your set amount.
- Click LESS to collapse the row again.
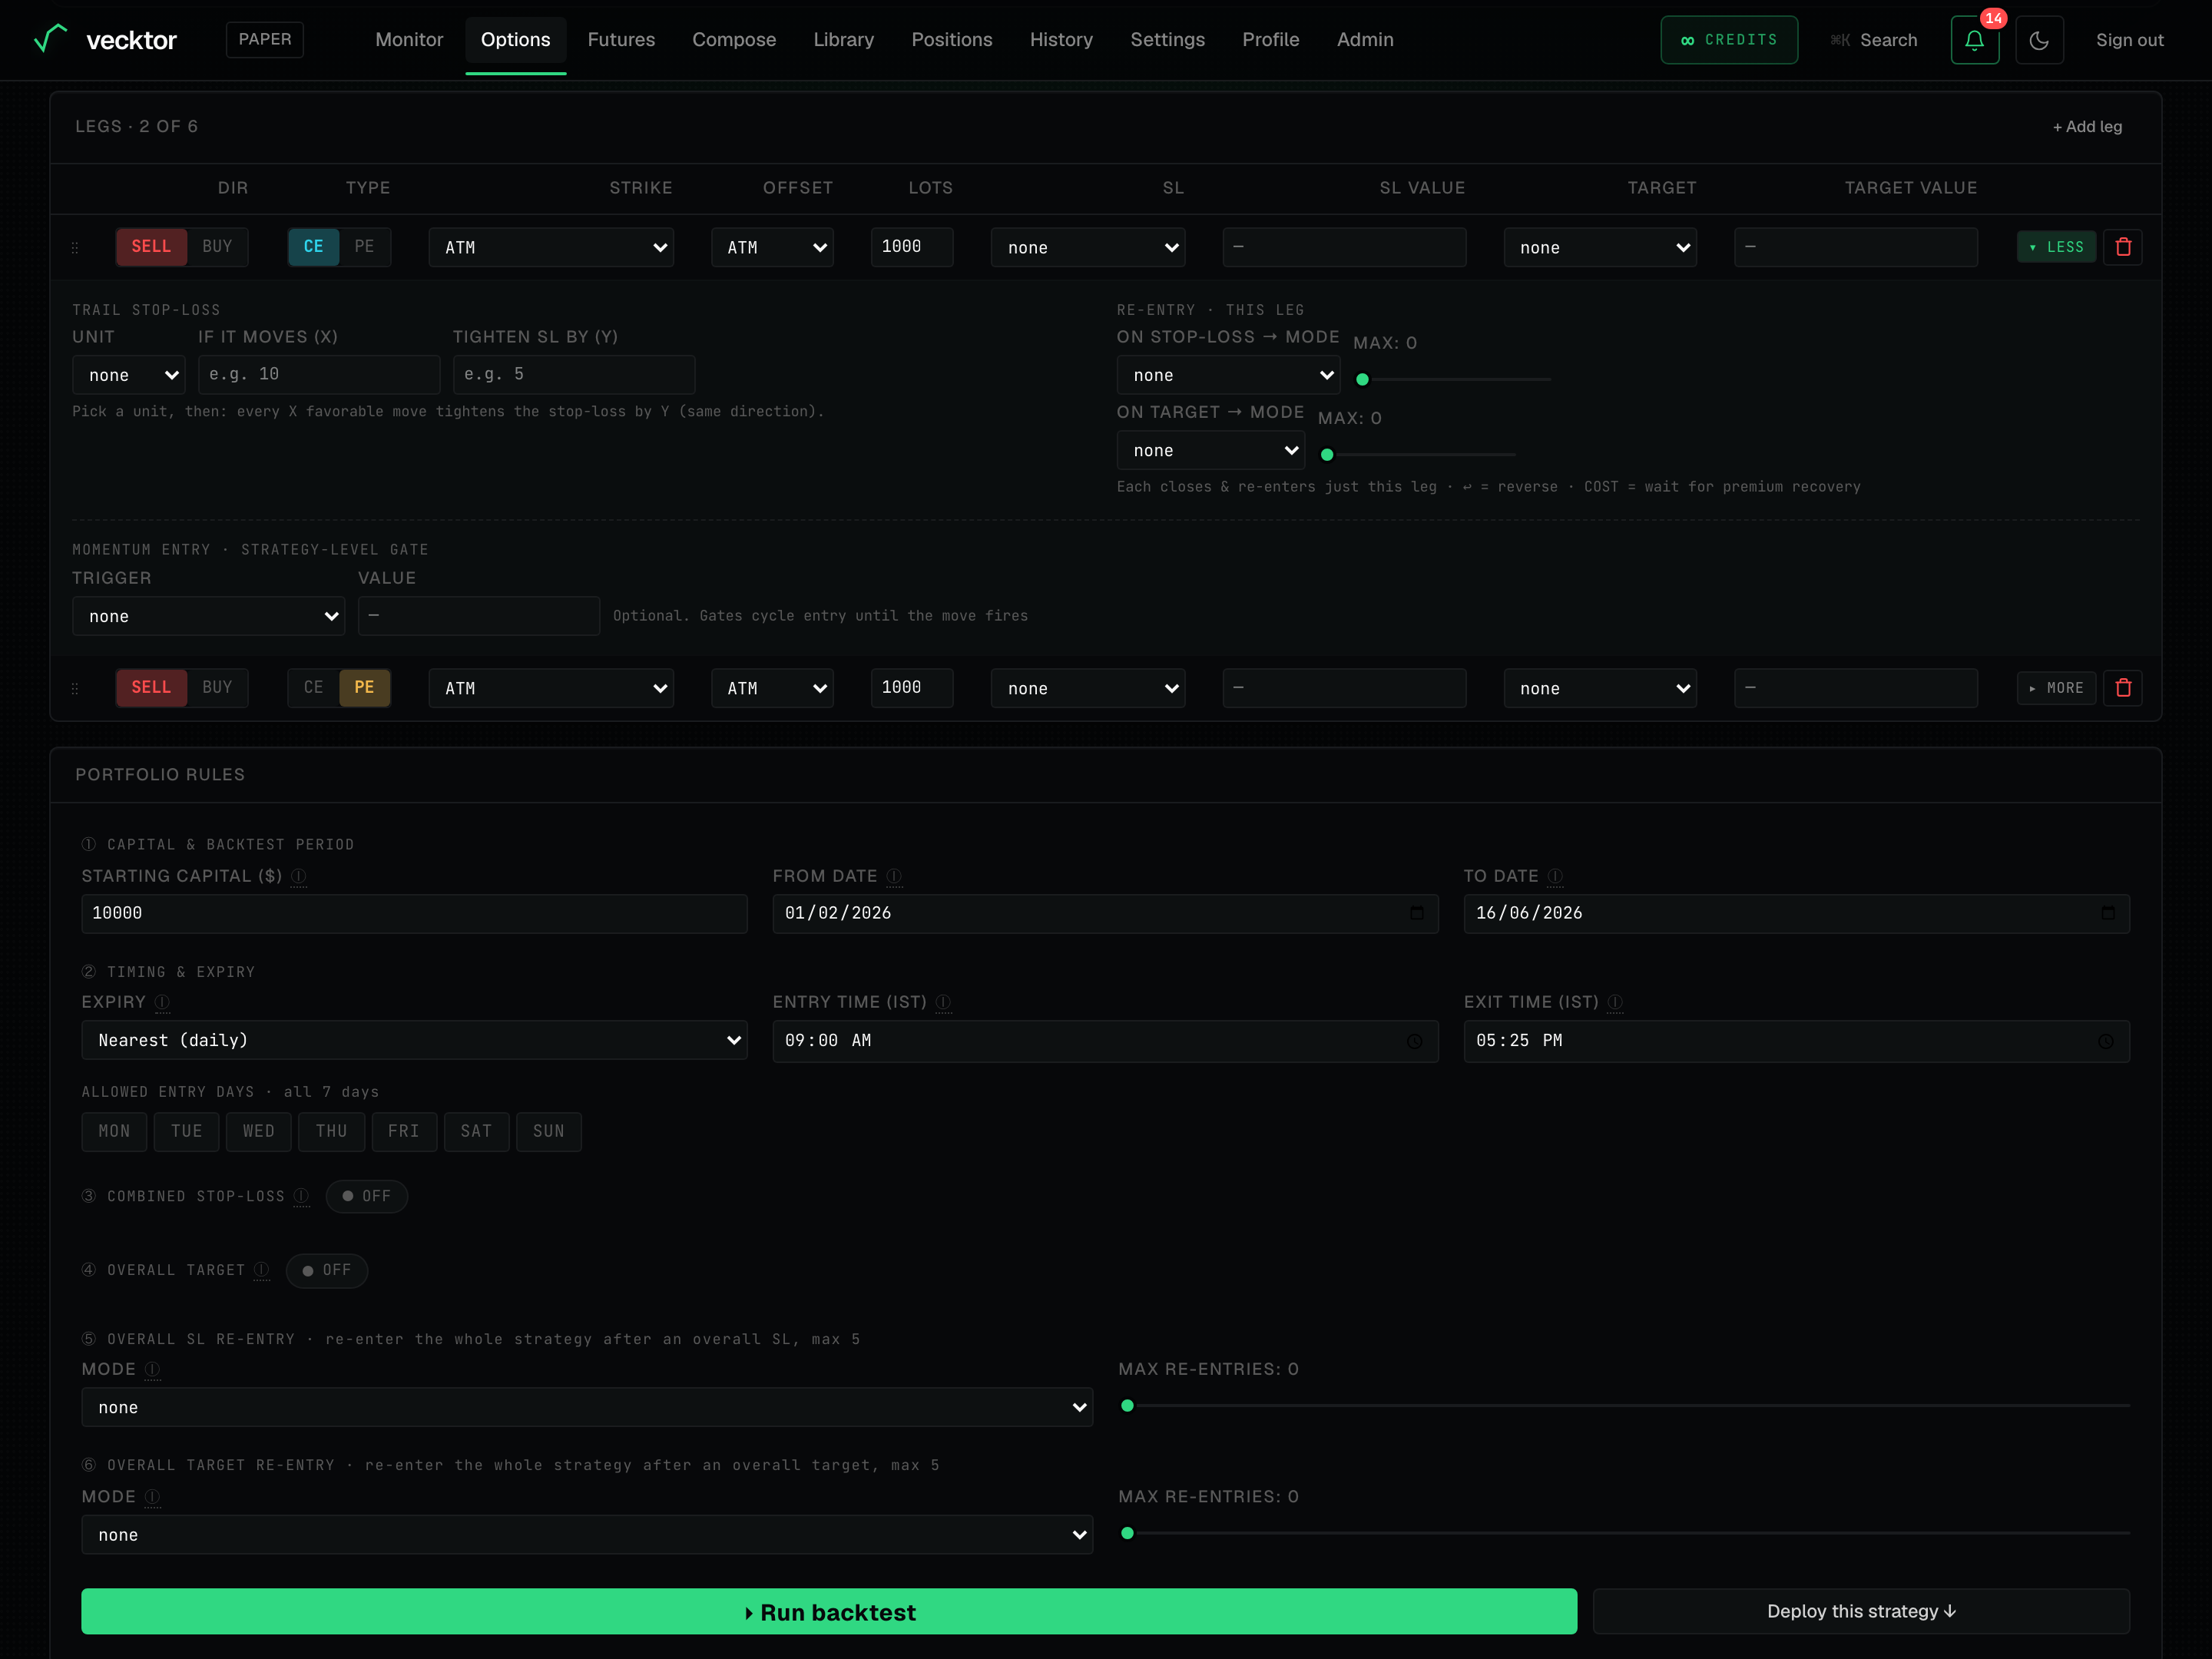 1Trailing stop (UNIT / X / Y)2Re-entry: Instant / At Entry Price / On Momentum / Flip
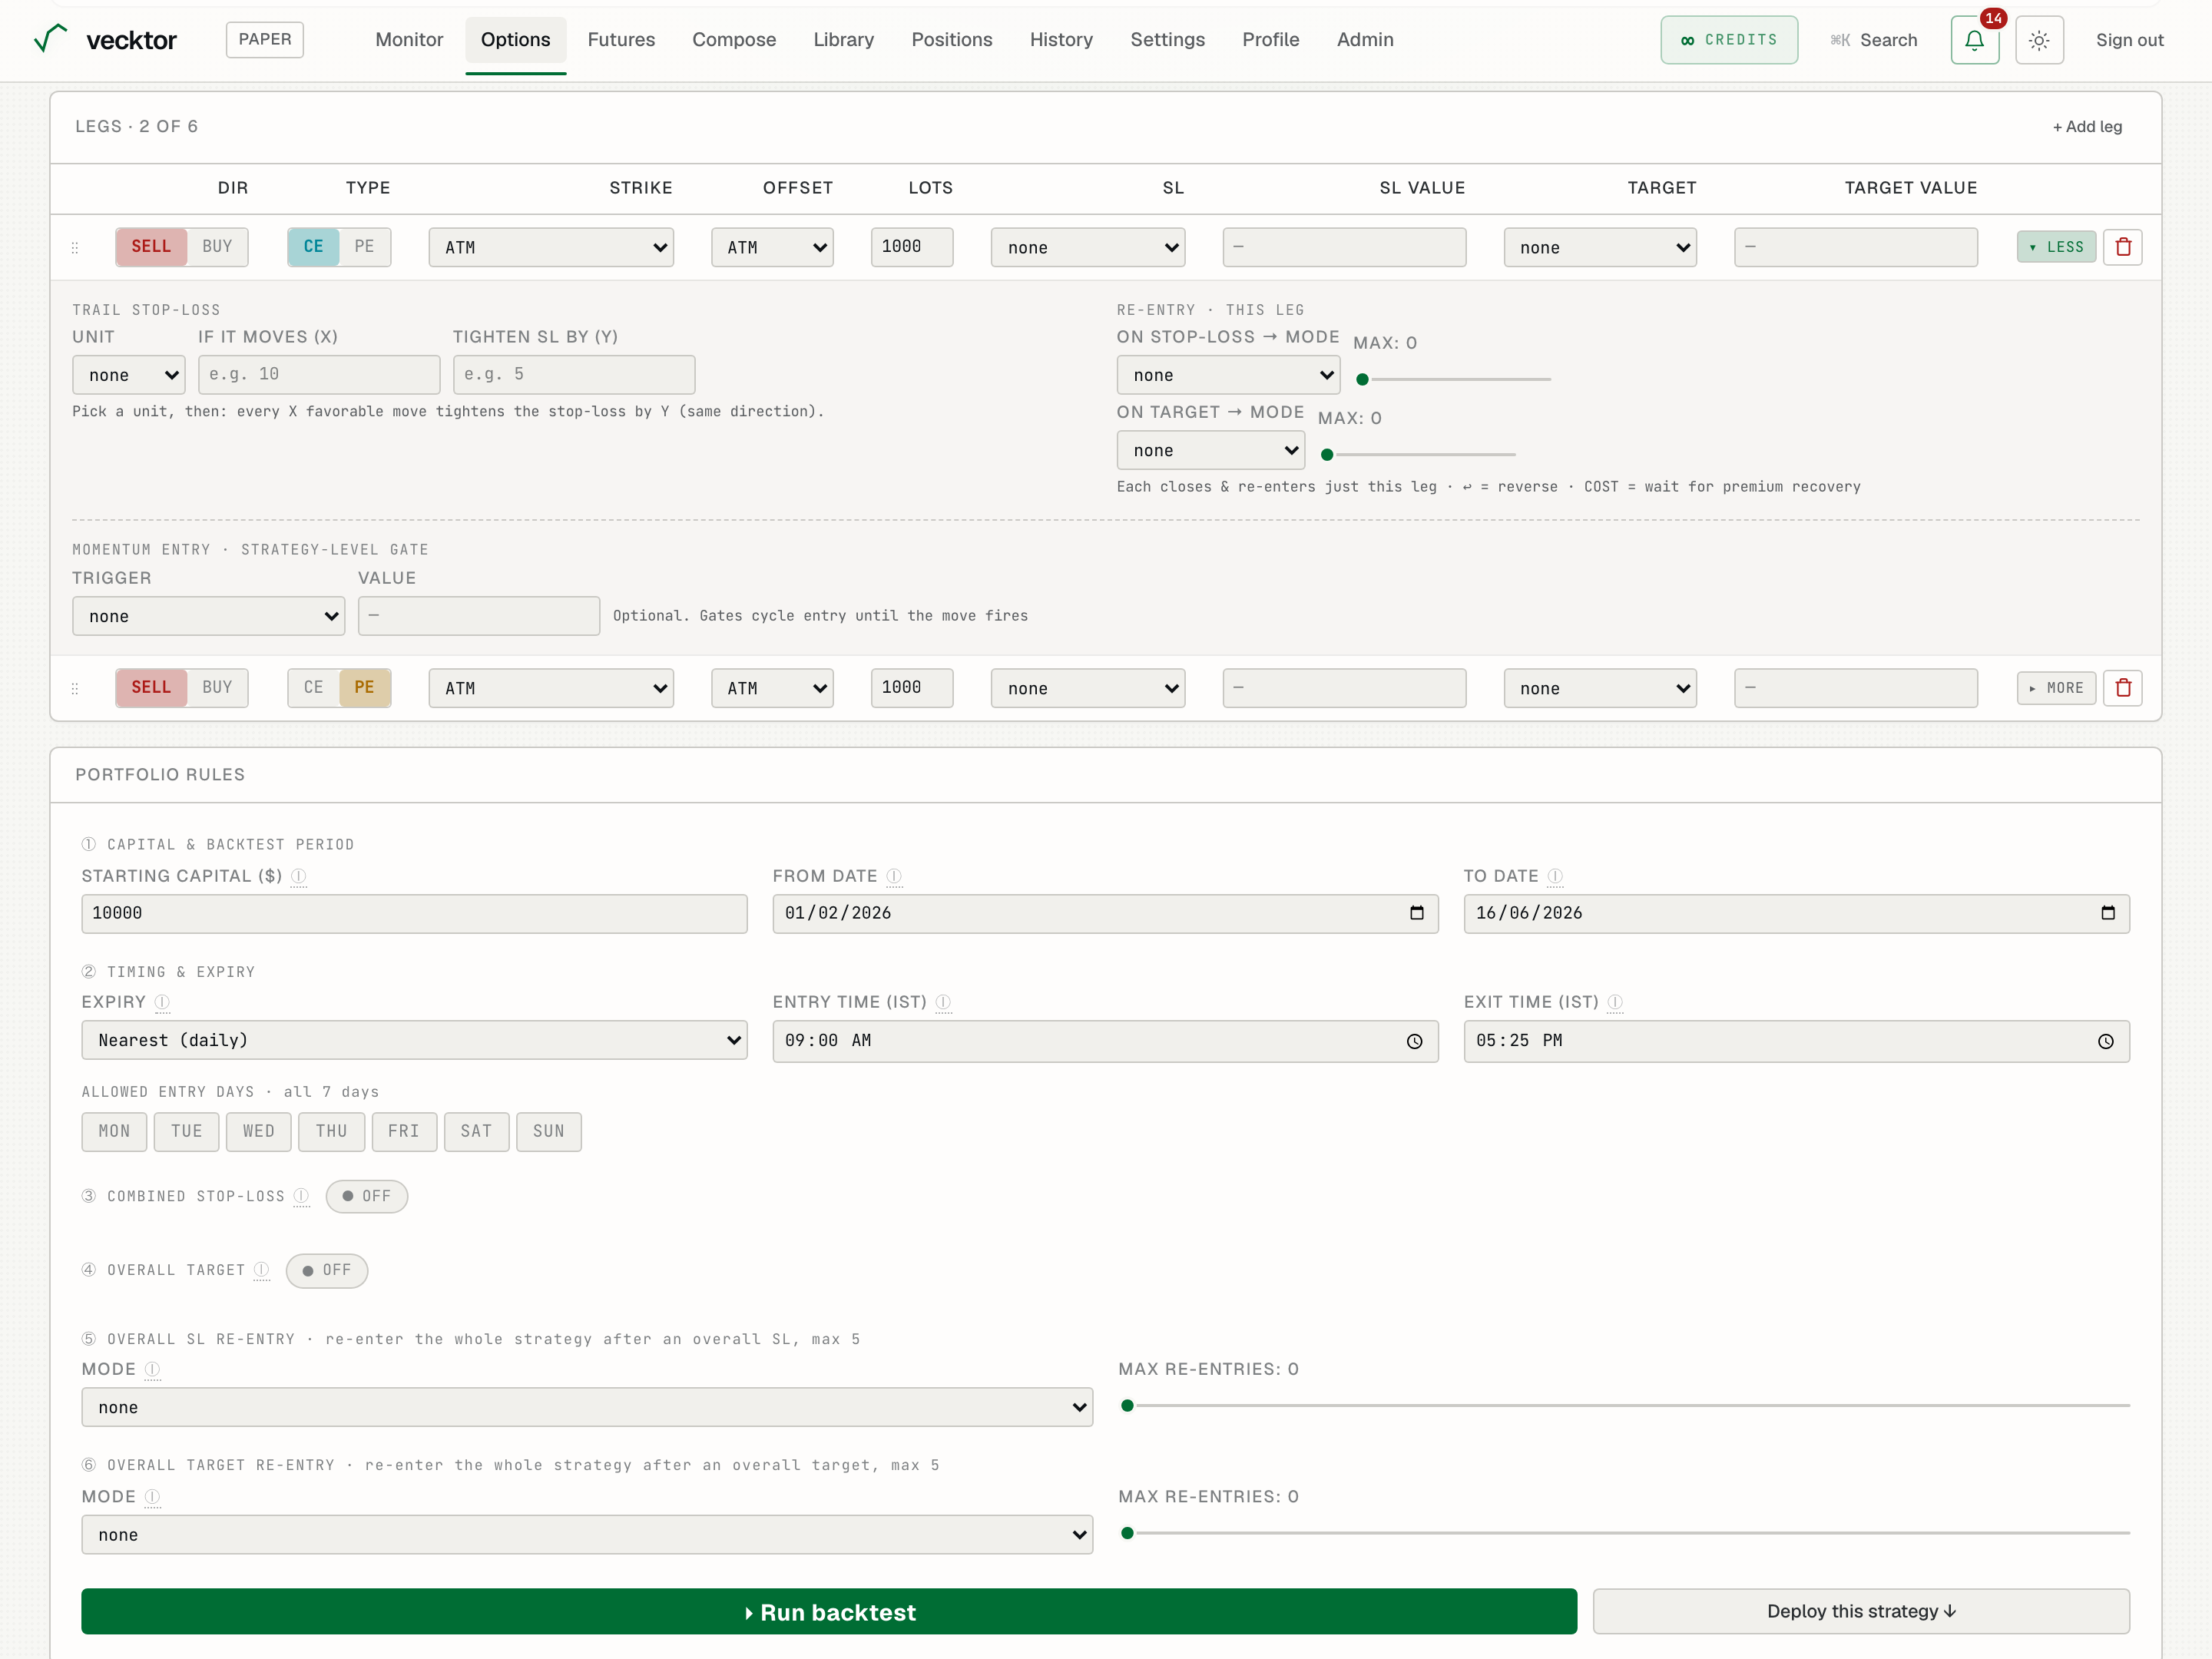
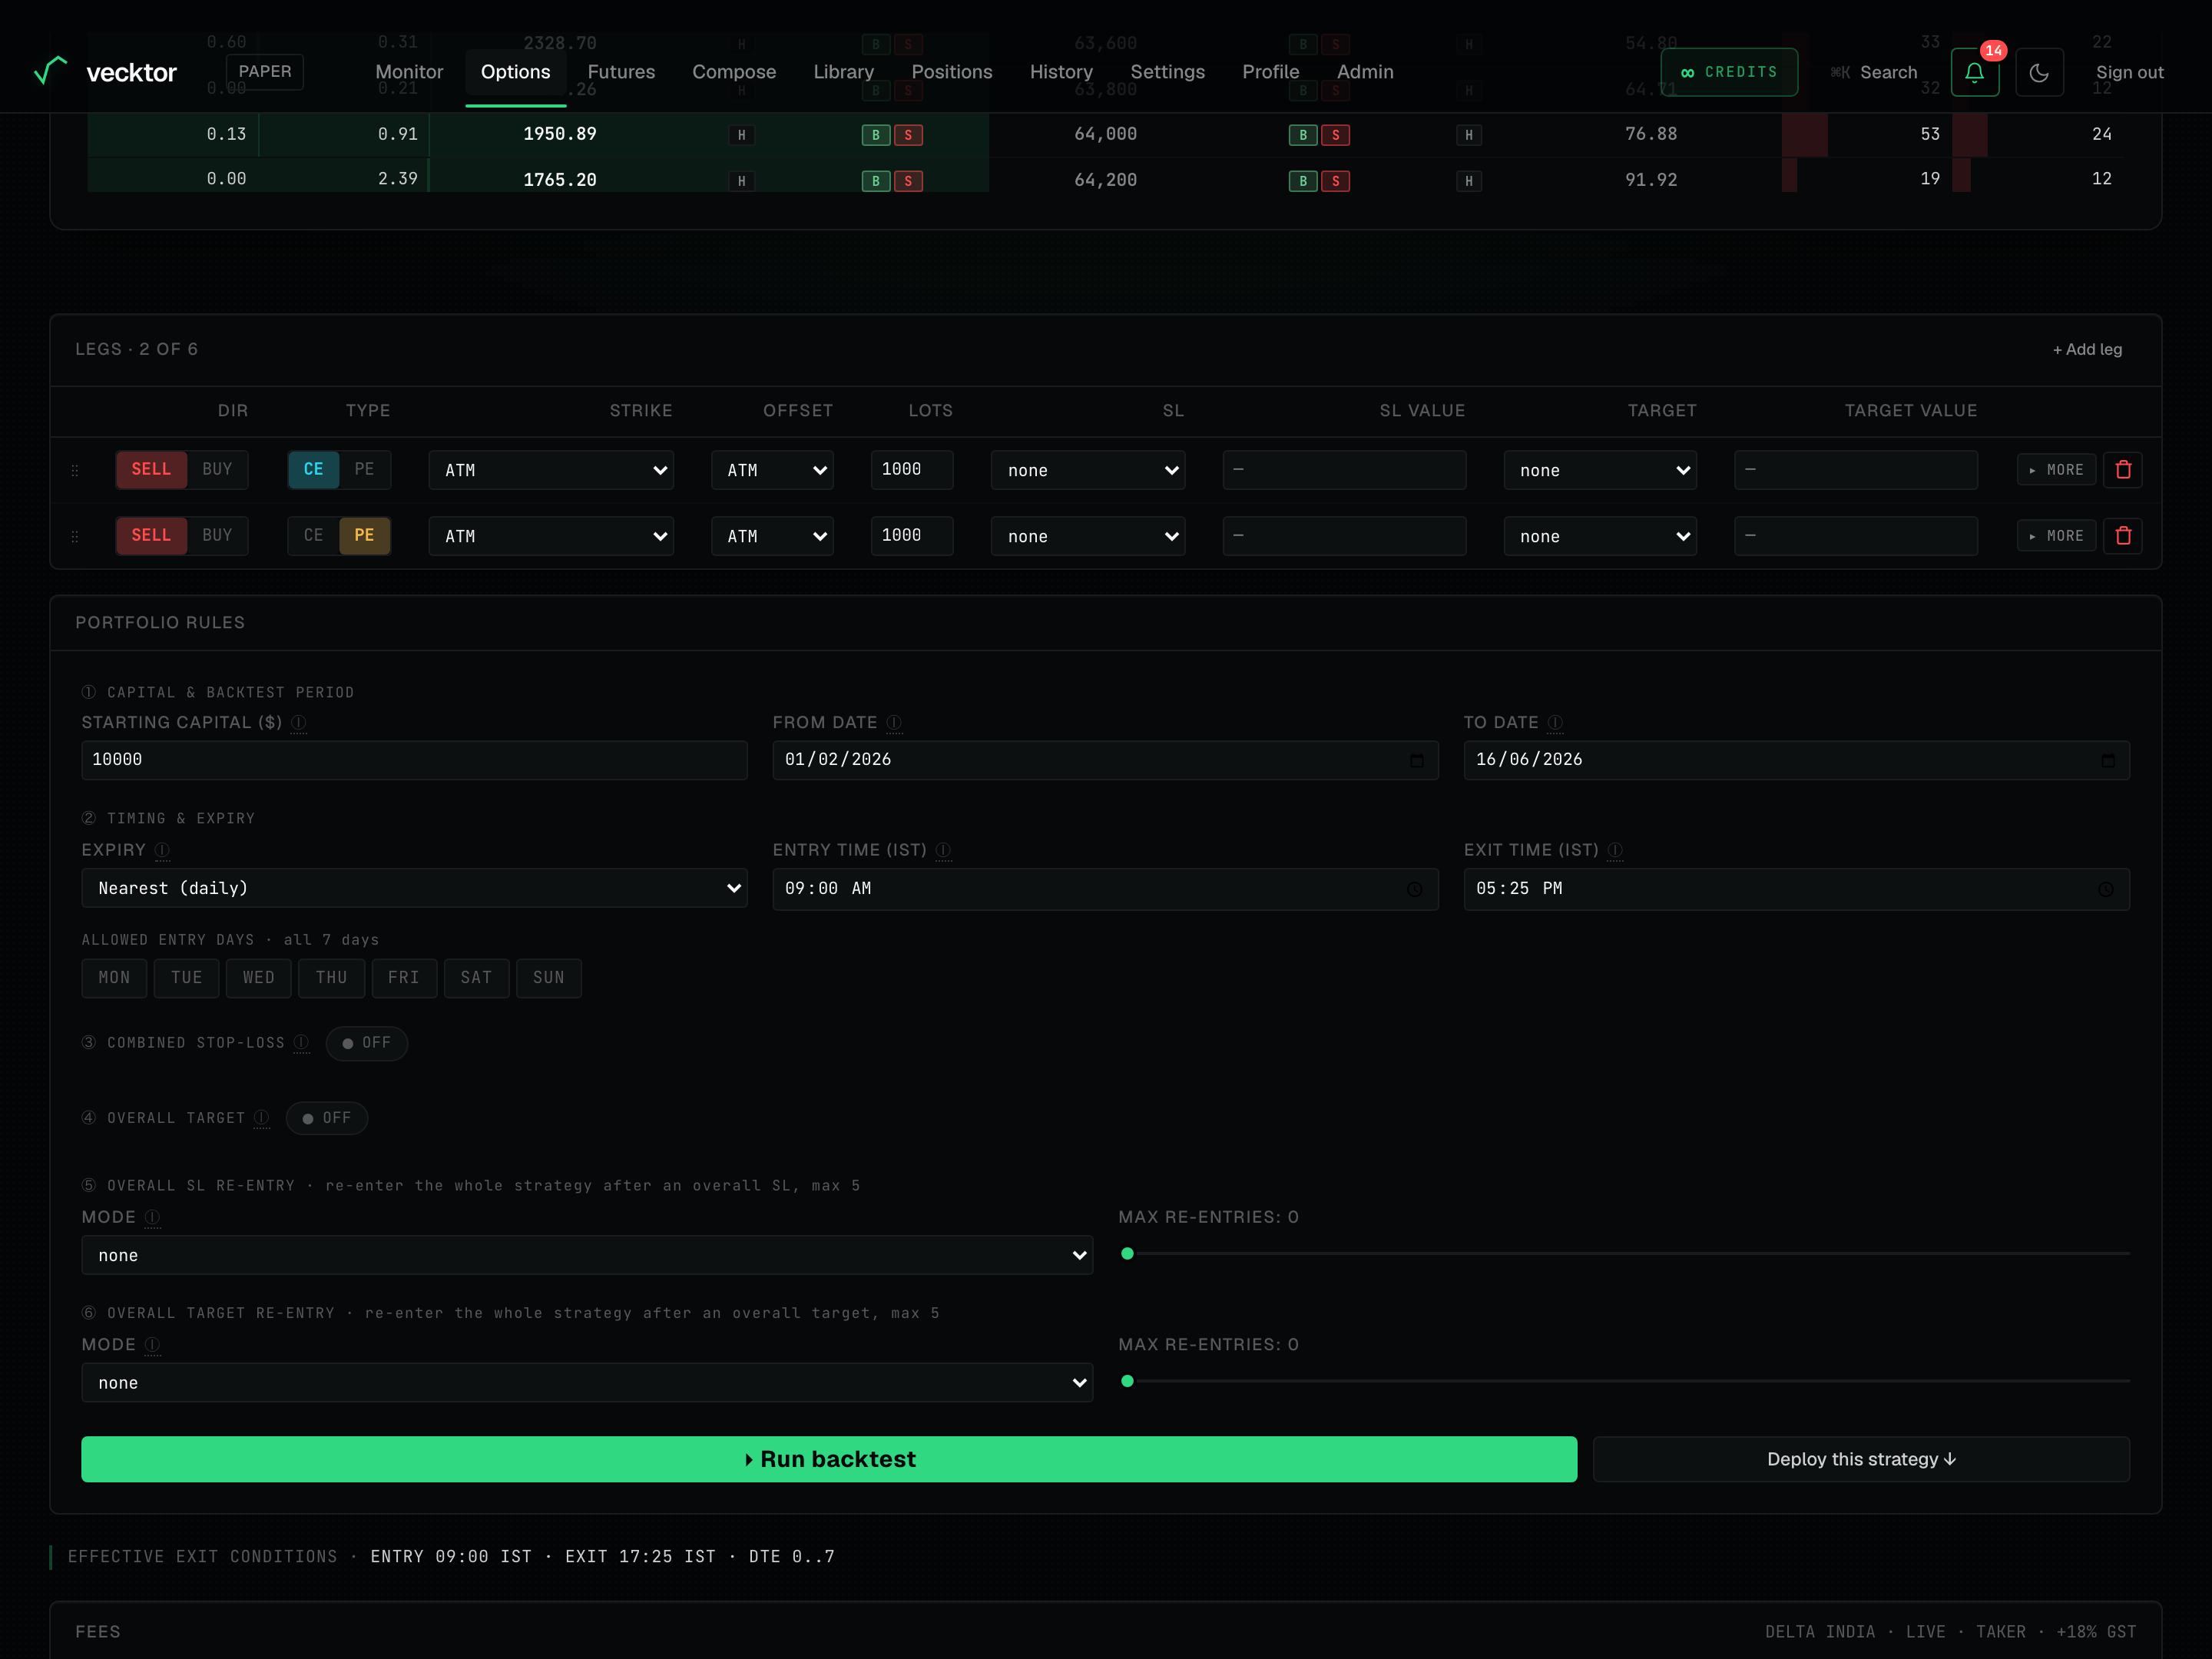
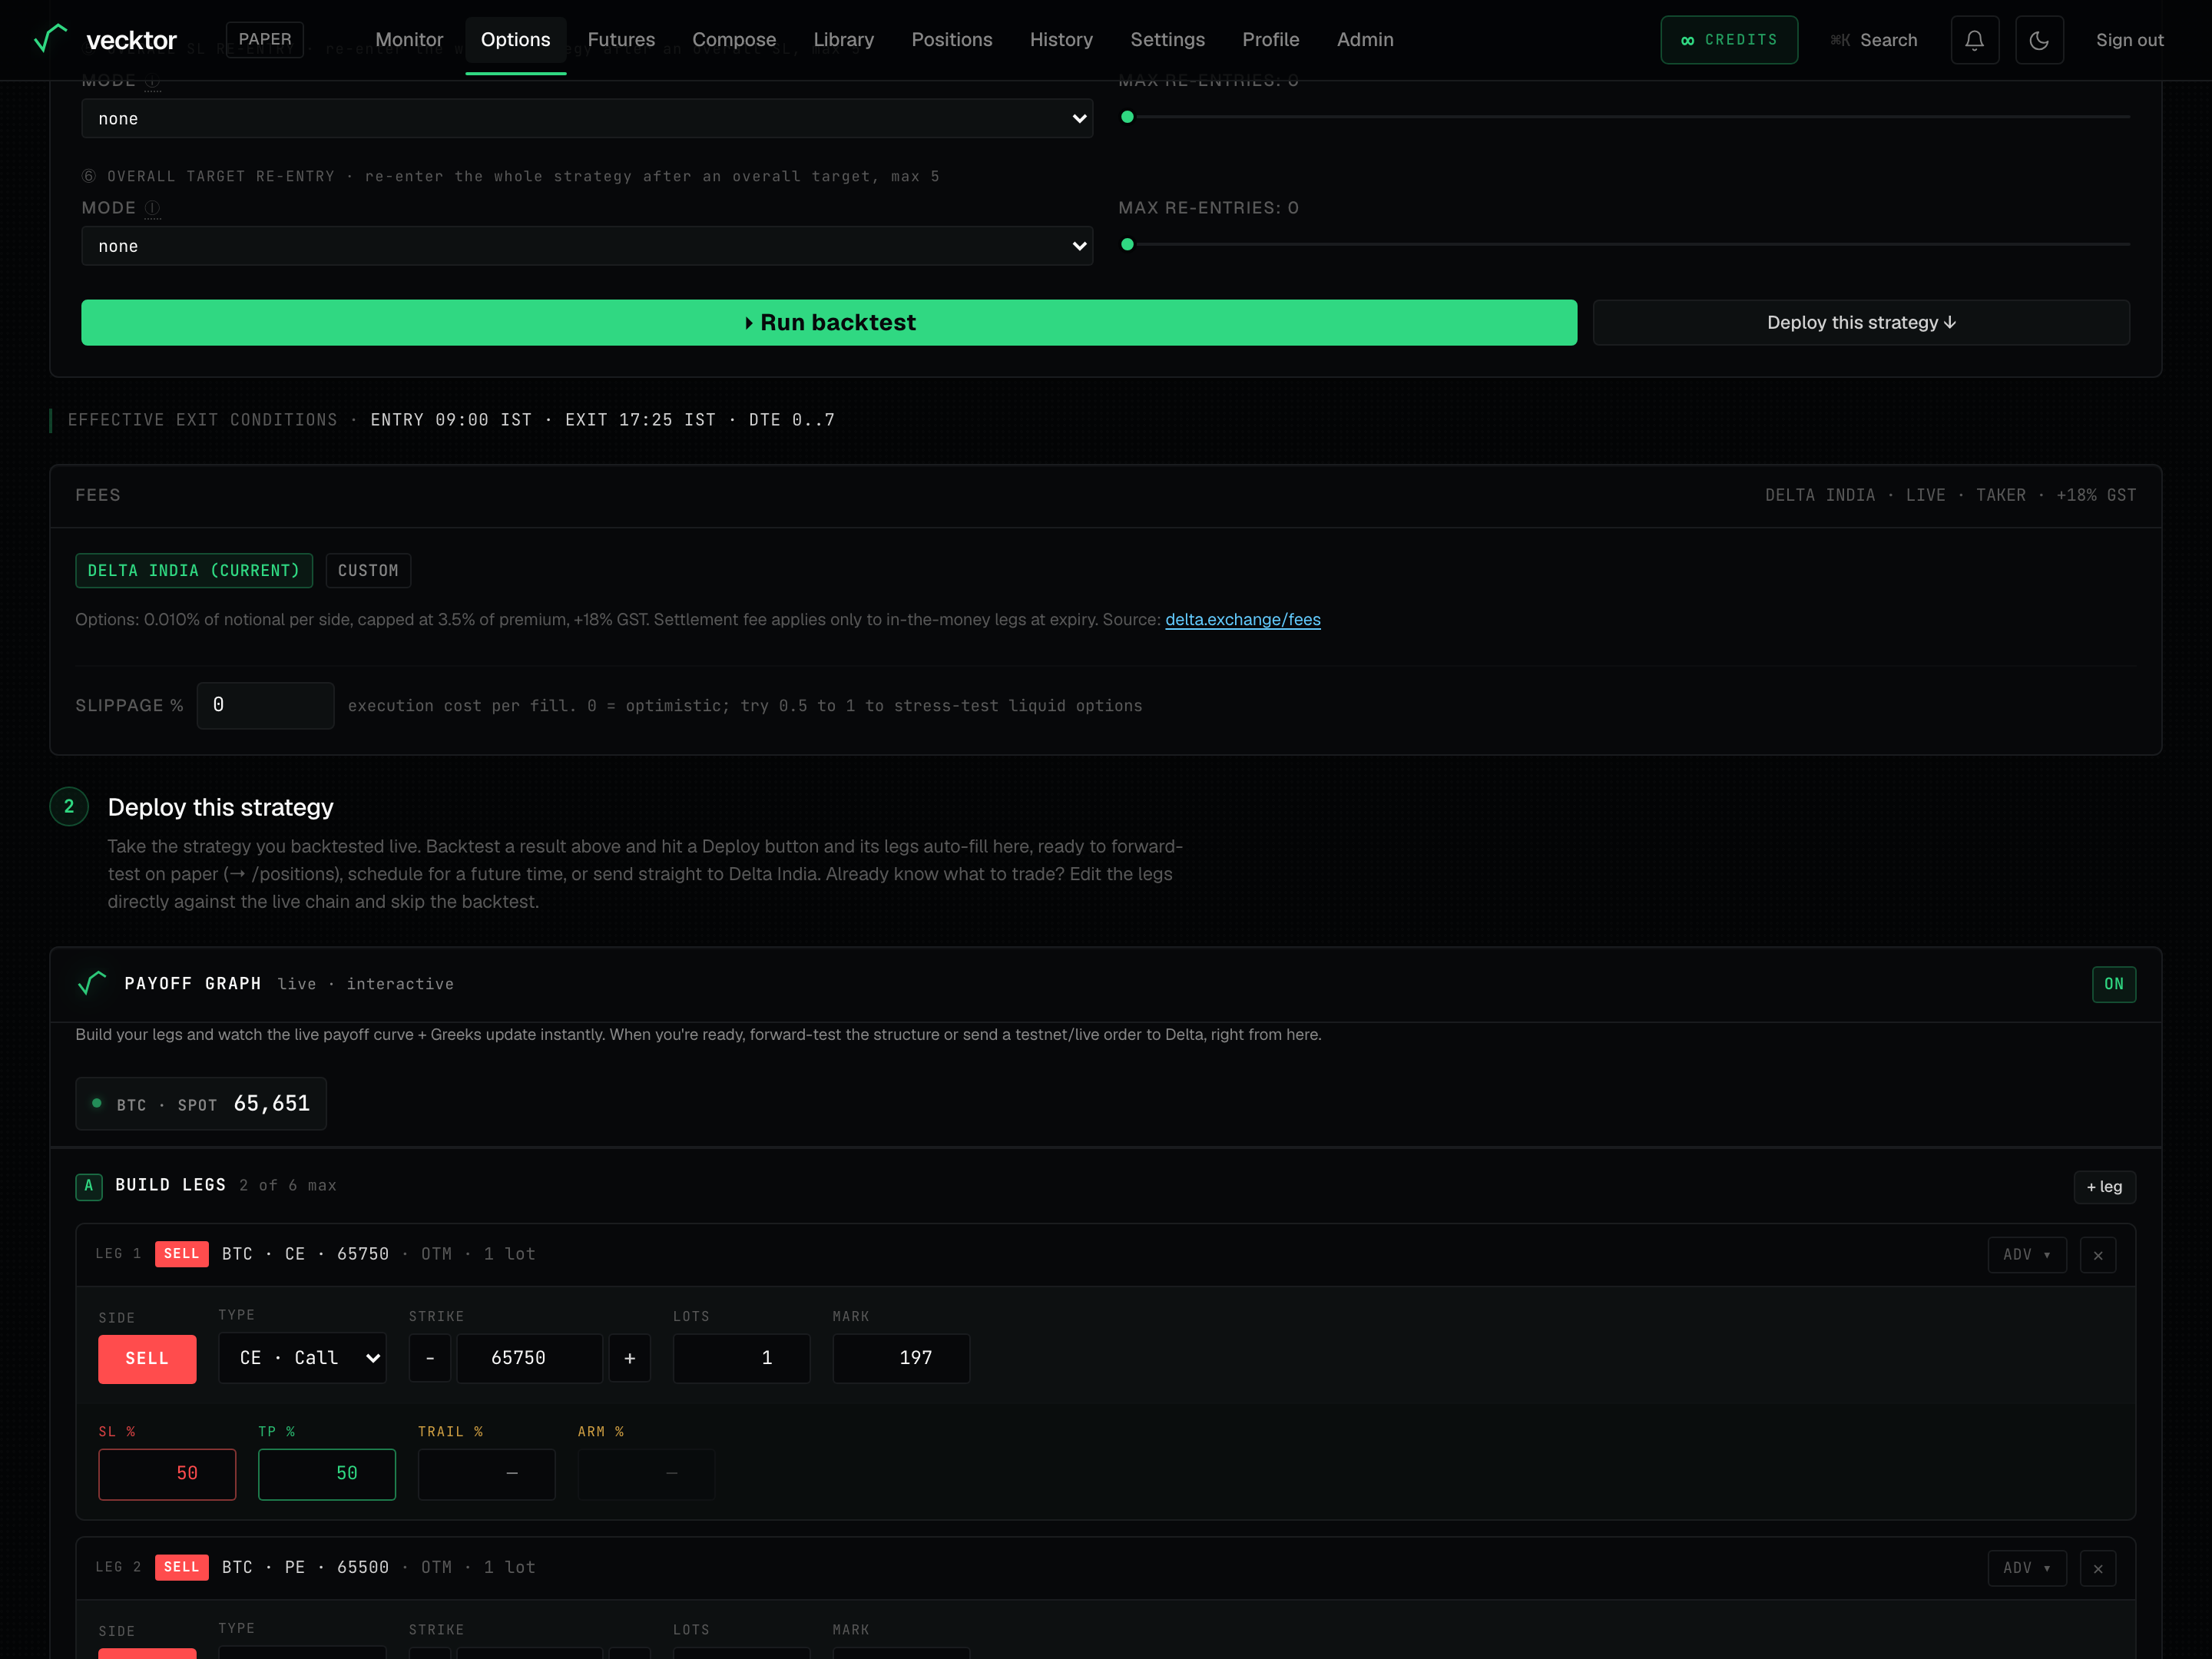
Whole-strategy stops, targets and re-entry (Portfolio rules)
Below the legs, Portfolio rules apply to the whole structure together.
- Combined stop-loss: Total premium SL % (a percent of the premium you collected) or Overall MTM SL (a dollar drawdown on open P&L). MTM means mark to market, your live open P&L.
- Overall target: take profit on the whole strategy by dollar profit or by percent of premium.
- Overall re-entry: after a whole-strategy stop or target, re-enter every leg with Instant, On Momentum, or their Flip ⇄ variants (Max re-entries caps it).
- Lock & Trail arms a trailing exit on the whole strategy once it is in profit.
Set capital, expiry window, time and days
These inputs frame when and how the backtest enters.
- Set starting capital so returns are shown as a percent of a real number.
- Set the date range to backtest over. The default starts where full chain data begins.
- Set the expiry rule (which expiry each cycle trades) and the days-to-expiry window.
- Set the entry and exit time in IST, and tick the weekdays you want to trade.
 1Starting capital2Backtest start3Backtest end
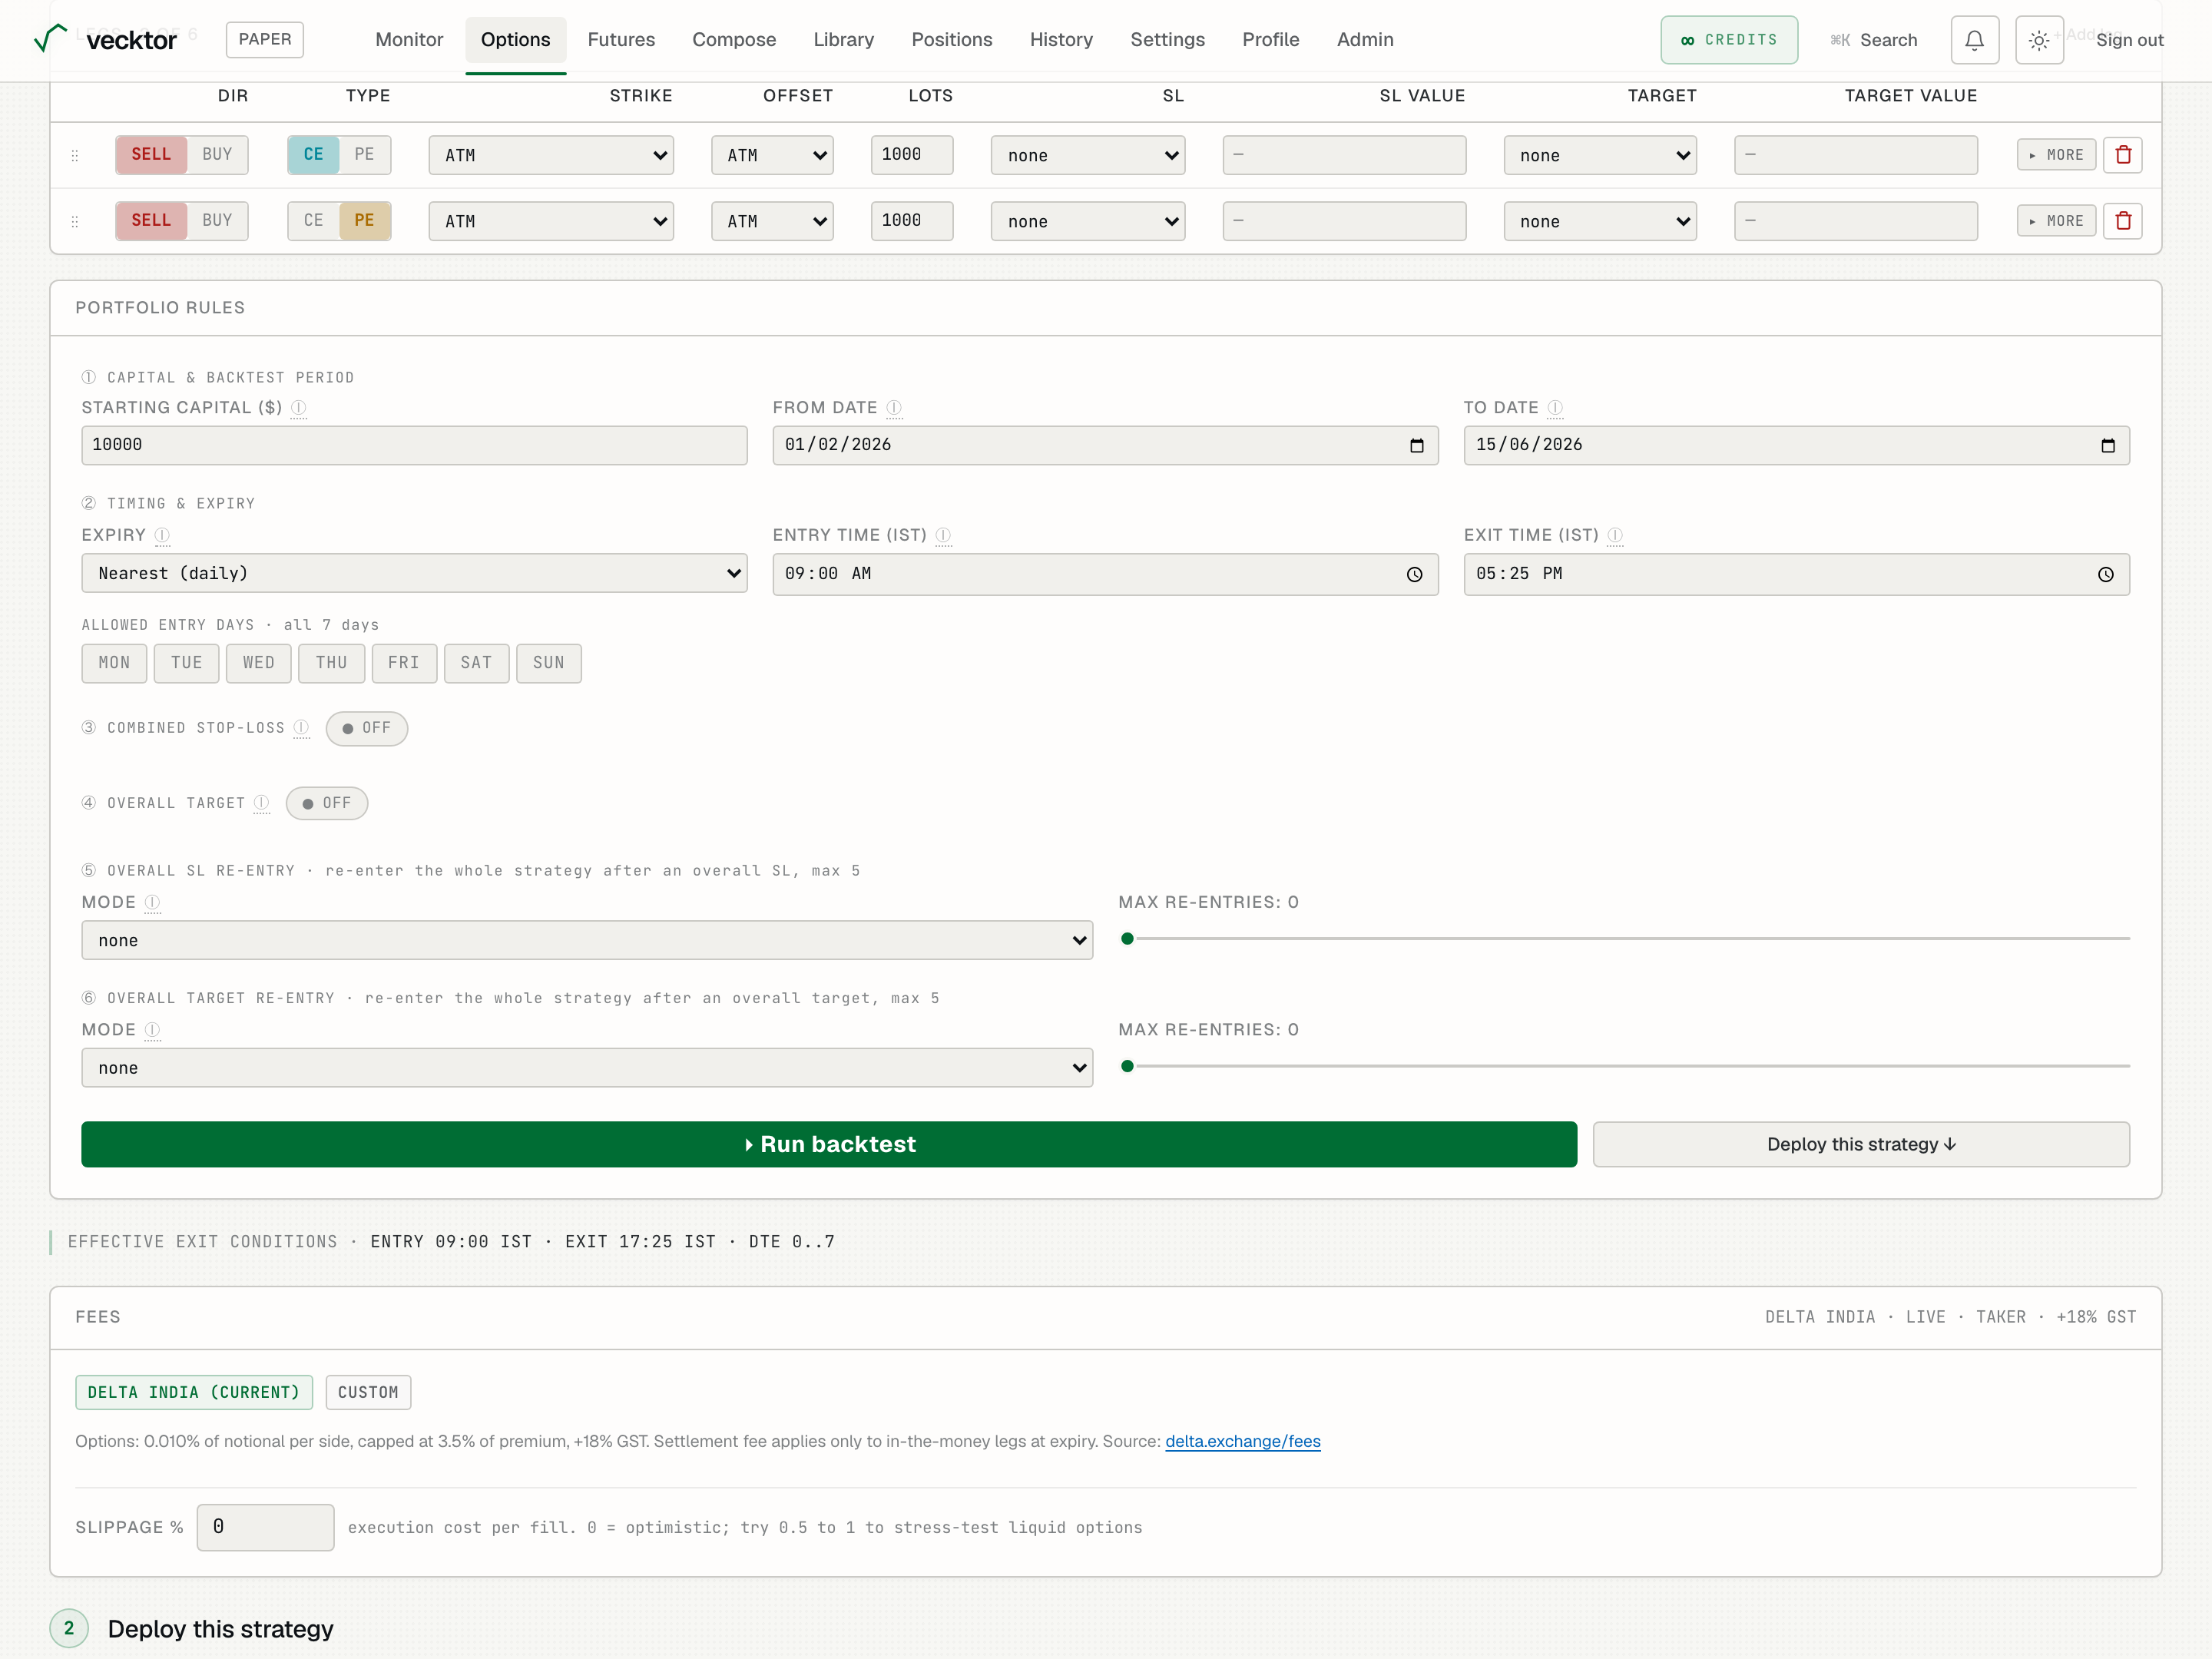
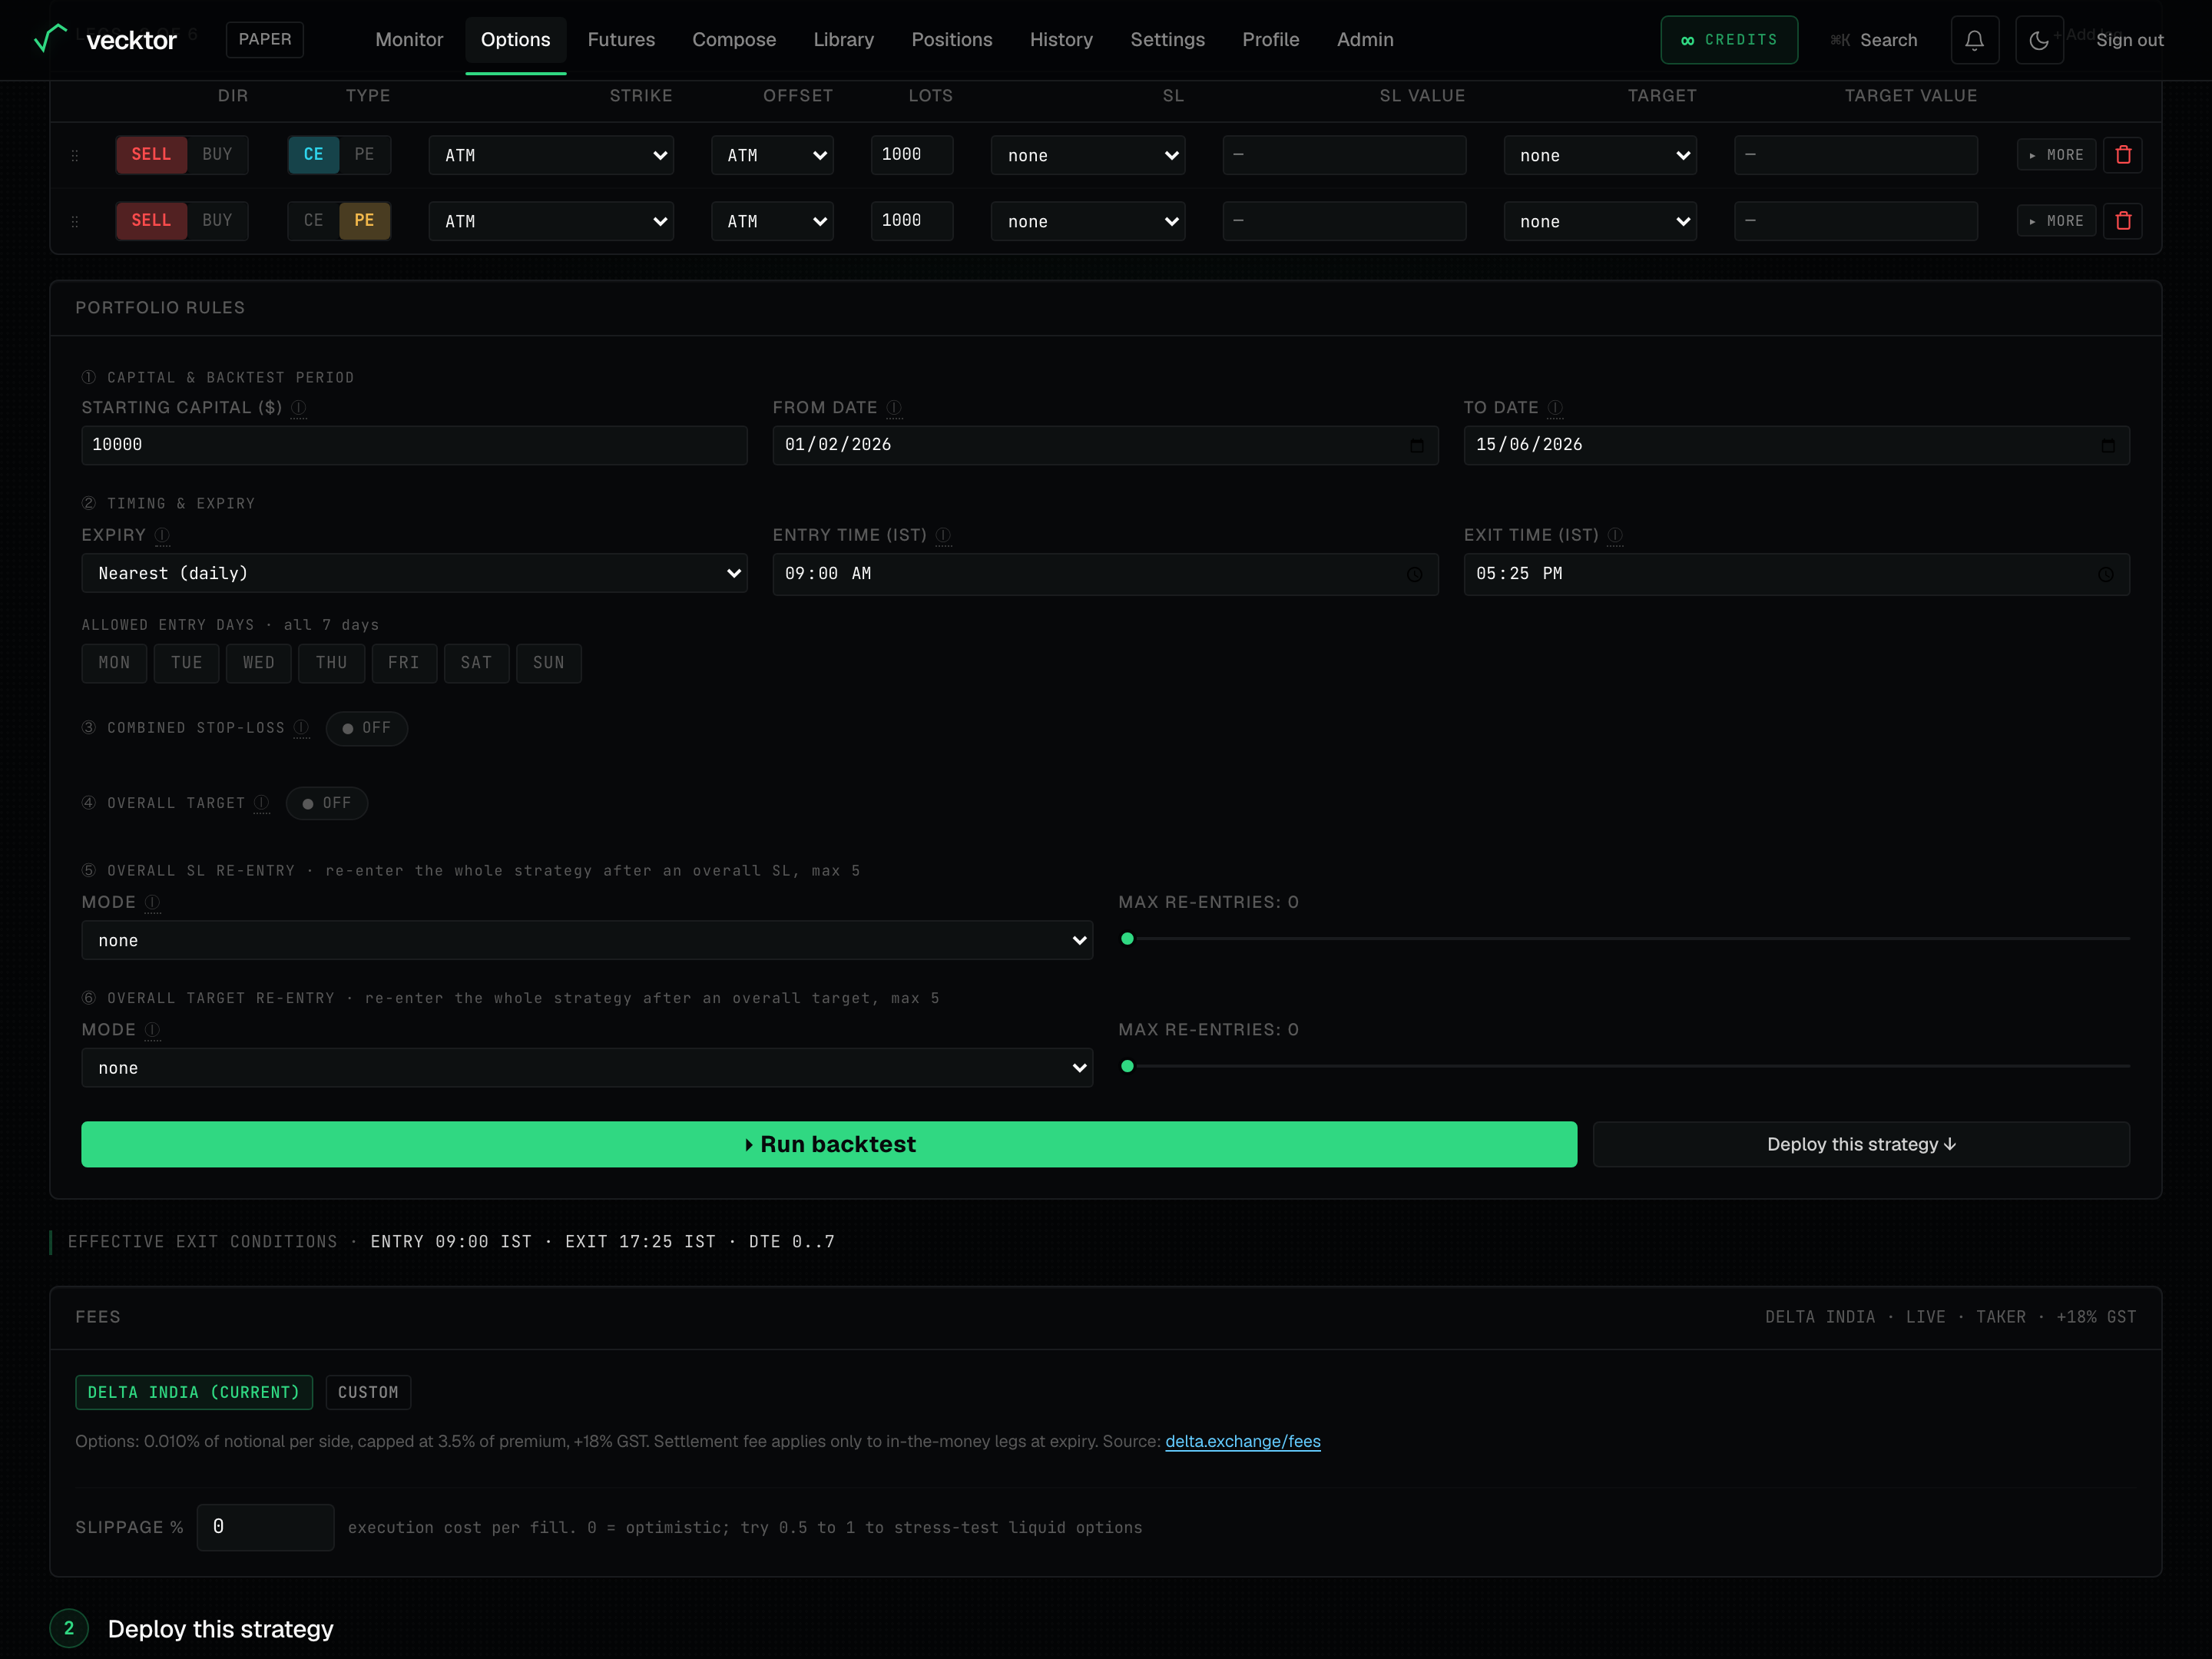
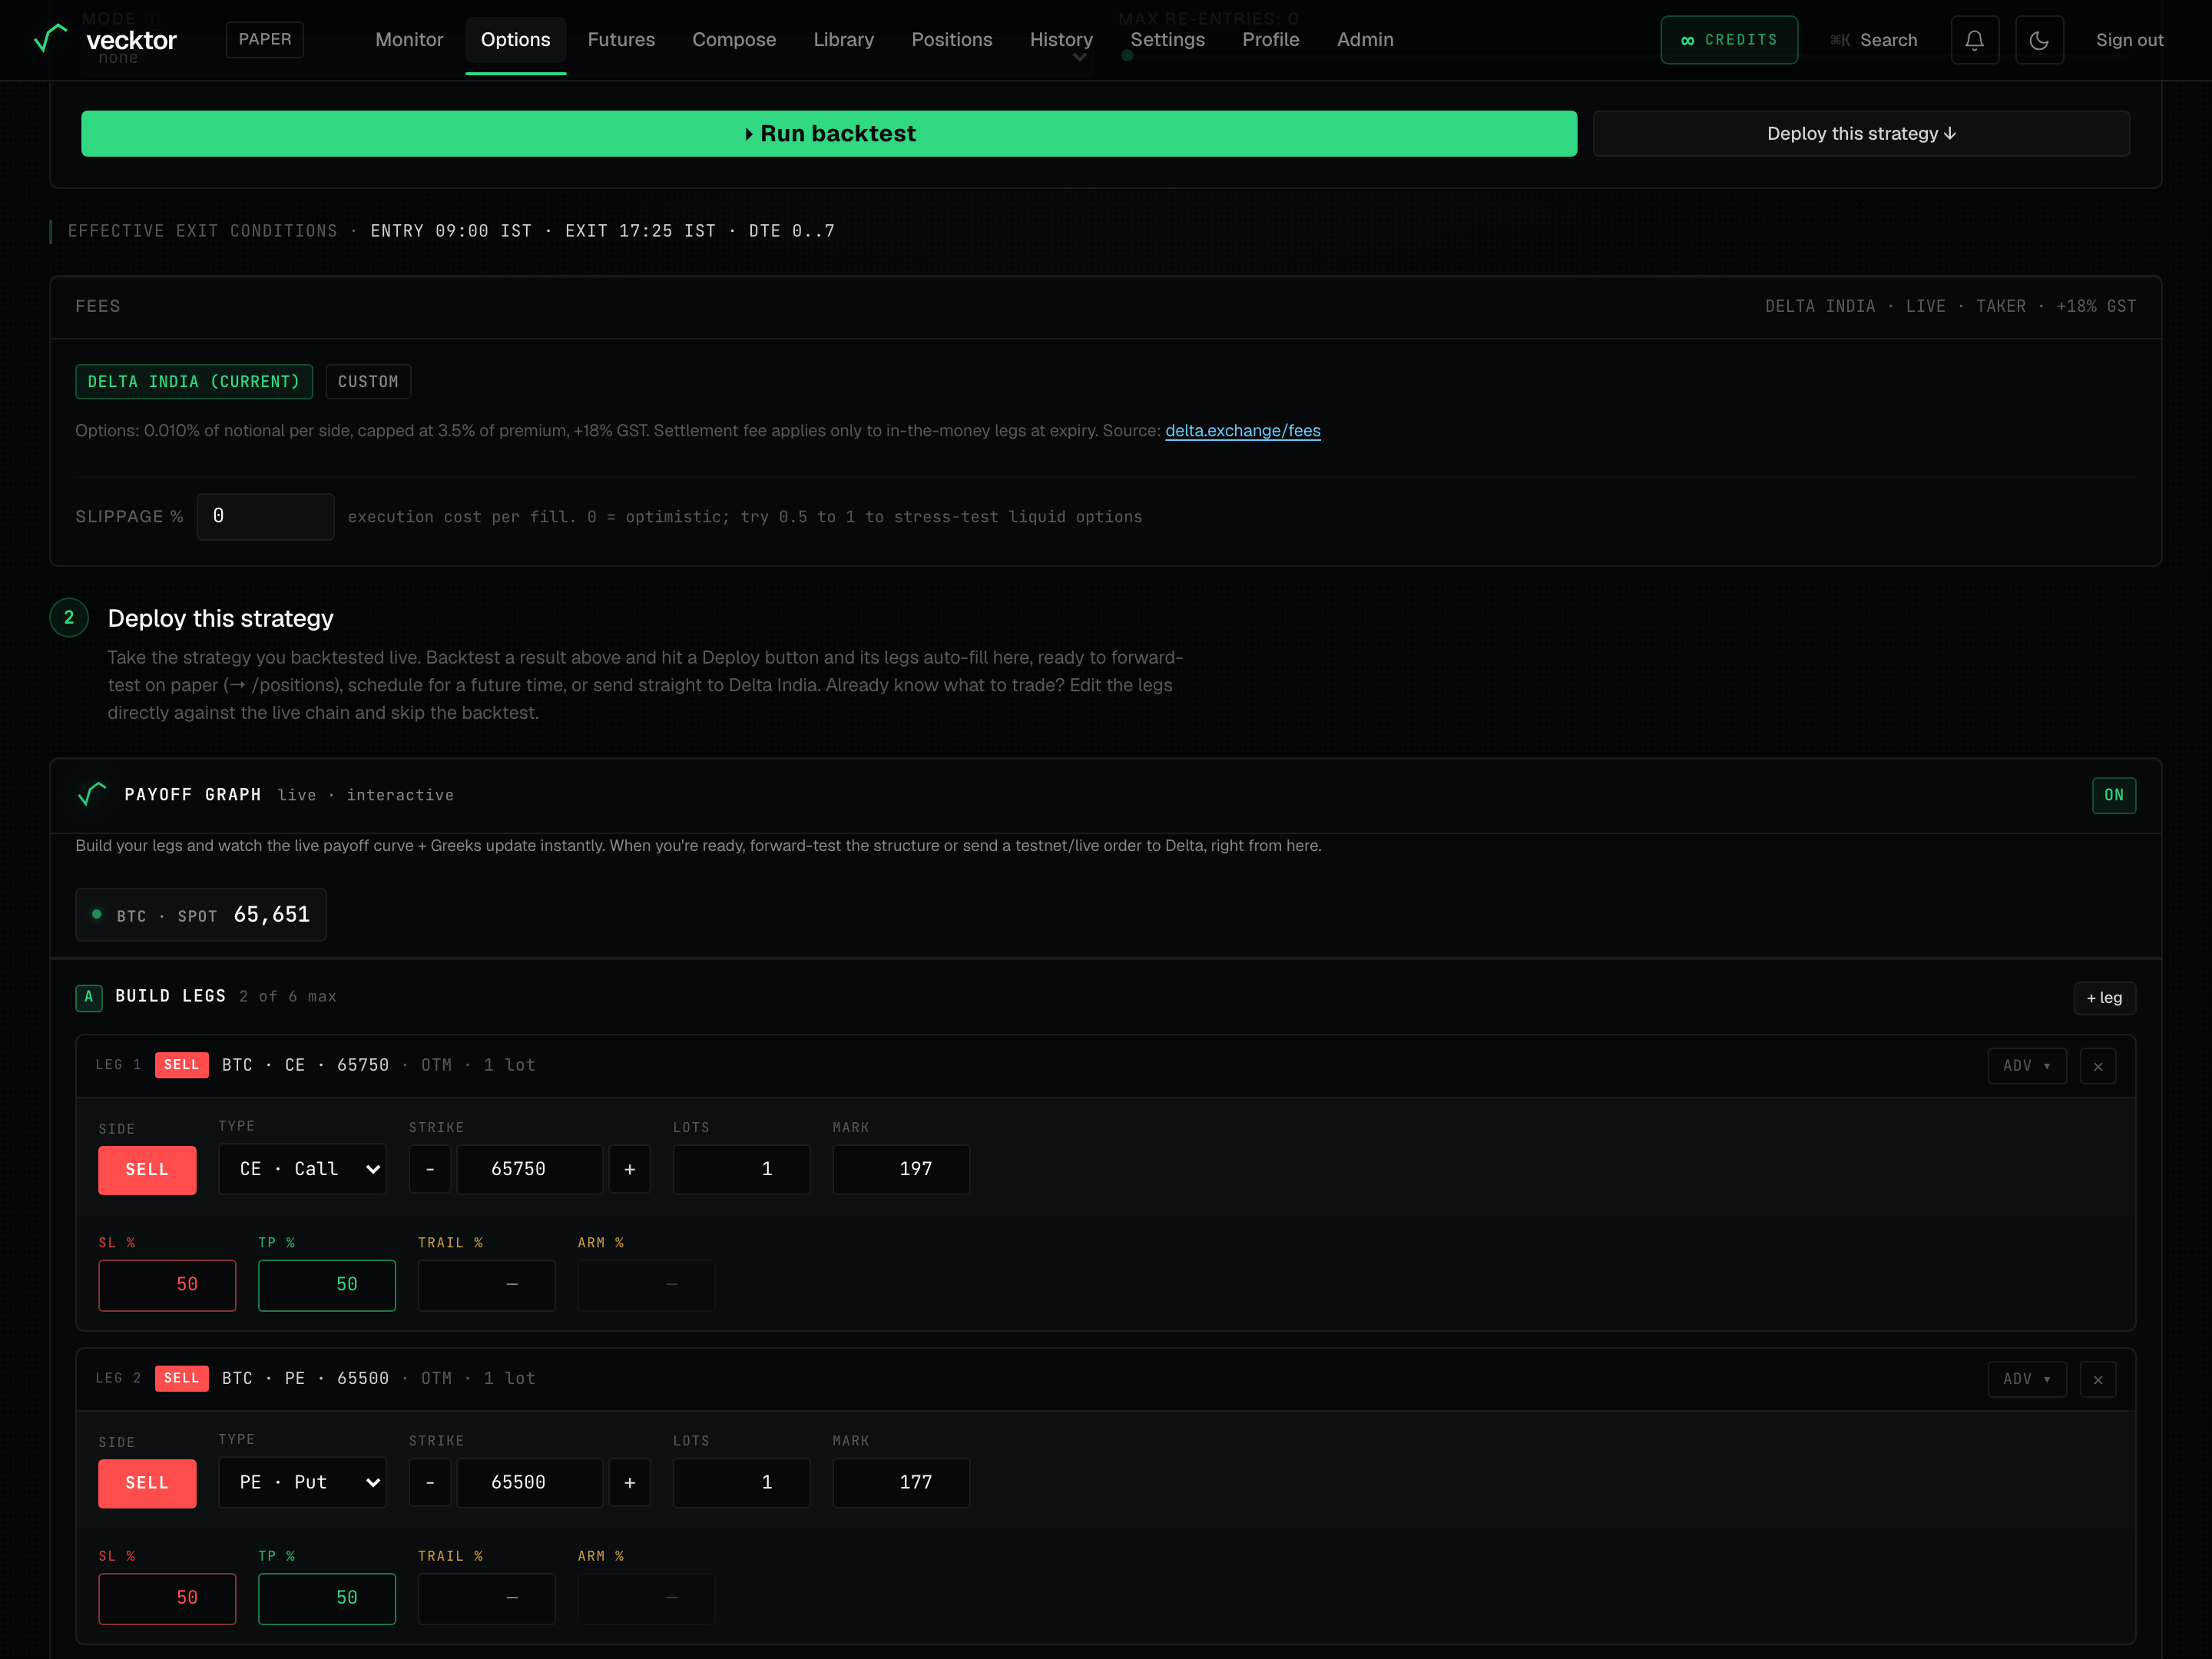
Set fees and slippage
Vecktor models real costs so the result is honest, not optimistic.
- Leave fees on the Delta India default, or switch to custom and set the fill side and GST.
- Set slippage percent per fill. 0 is optimistic; 0.5 to 1 stress-tests less liquid options.
- If you change slippage after a run, click Apply next to the field to re-run with the new value.
 1Fees (Delta India default)2Slippage % per fill (Apply re-runs)
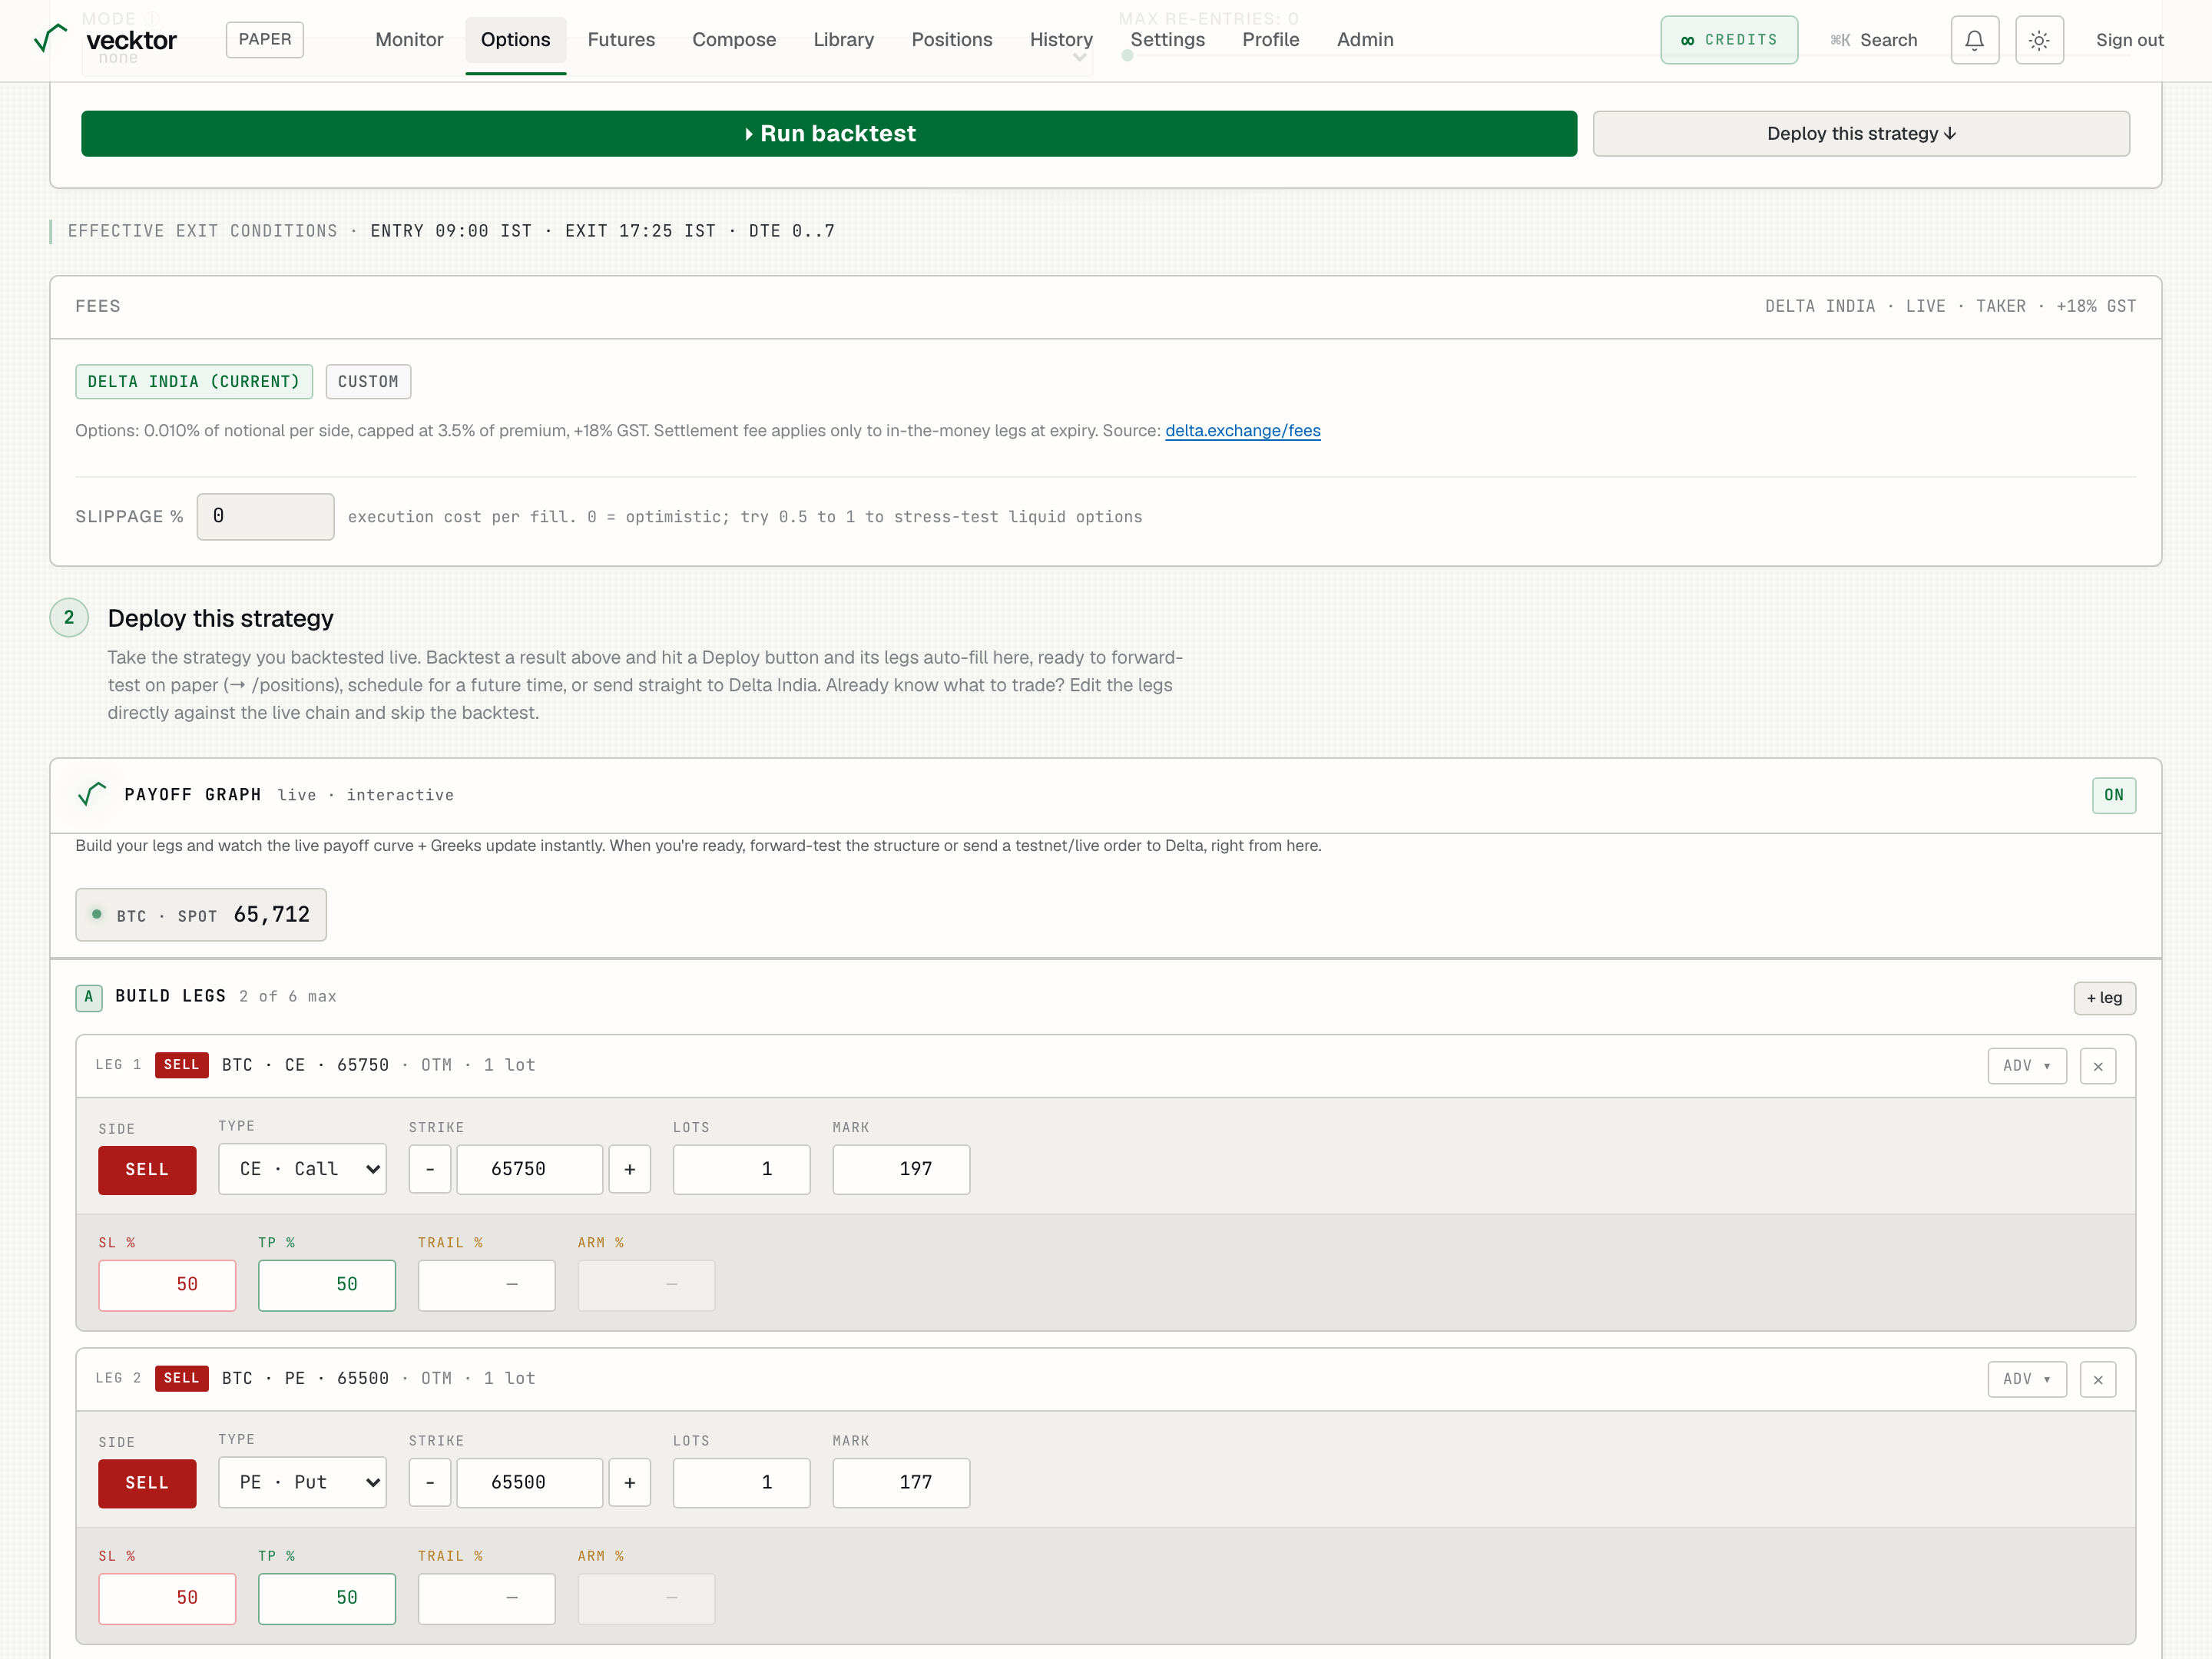
Run the backtest and fix errors
Running starts the backtest and streams a progress bar by date.
- Click Run. Watch the progress bar fill by trade date.
- If you see a strike collision error, your wings are wider than the listed chain. Use a quick-fix chip, narrow the wings, or extend the days-to-expiry.
- If you see a partial data coverage warning, your start date is before full chain data exists. Move the start date forward.
- Run the same strategy again and it returns instantly from cache.
 1Run the backtest
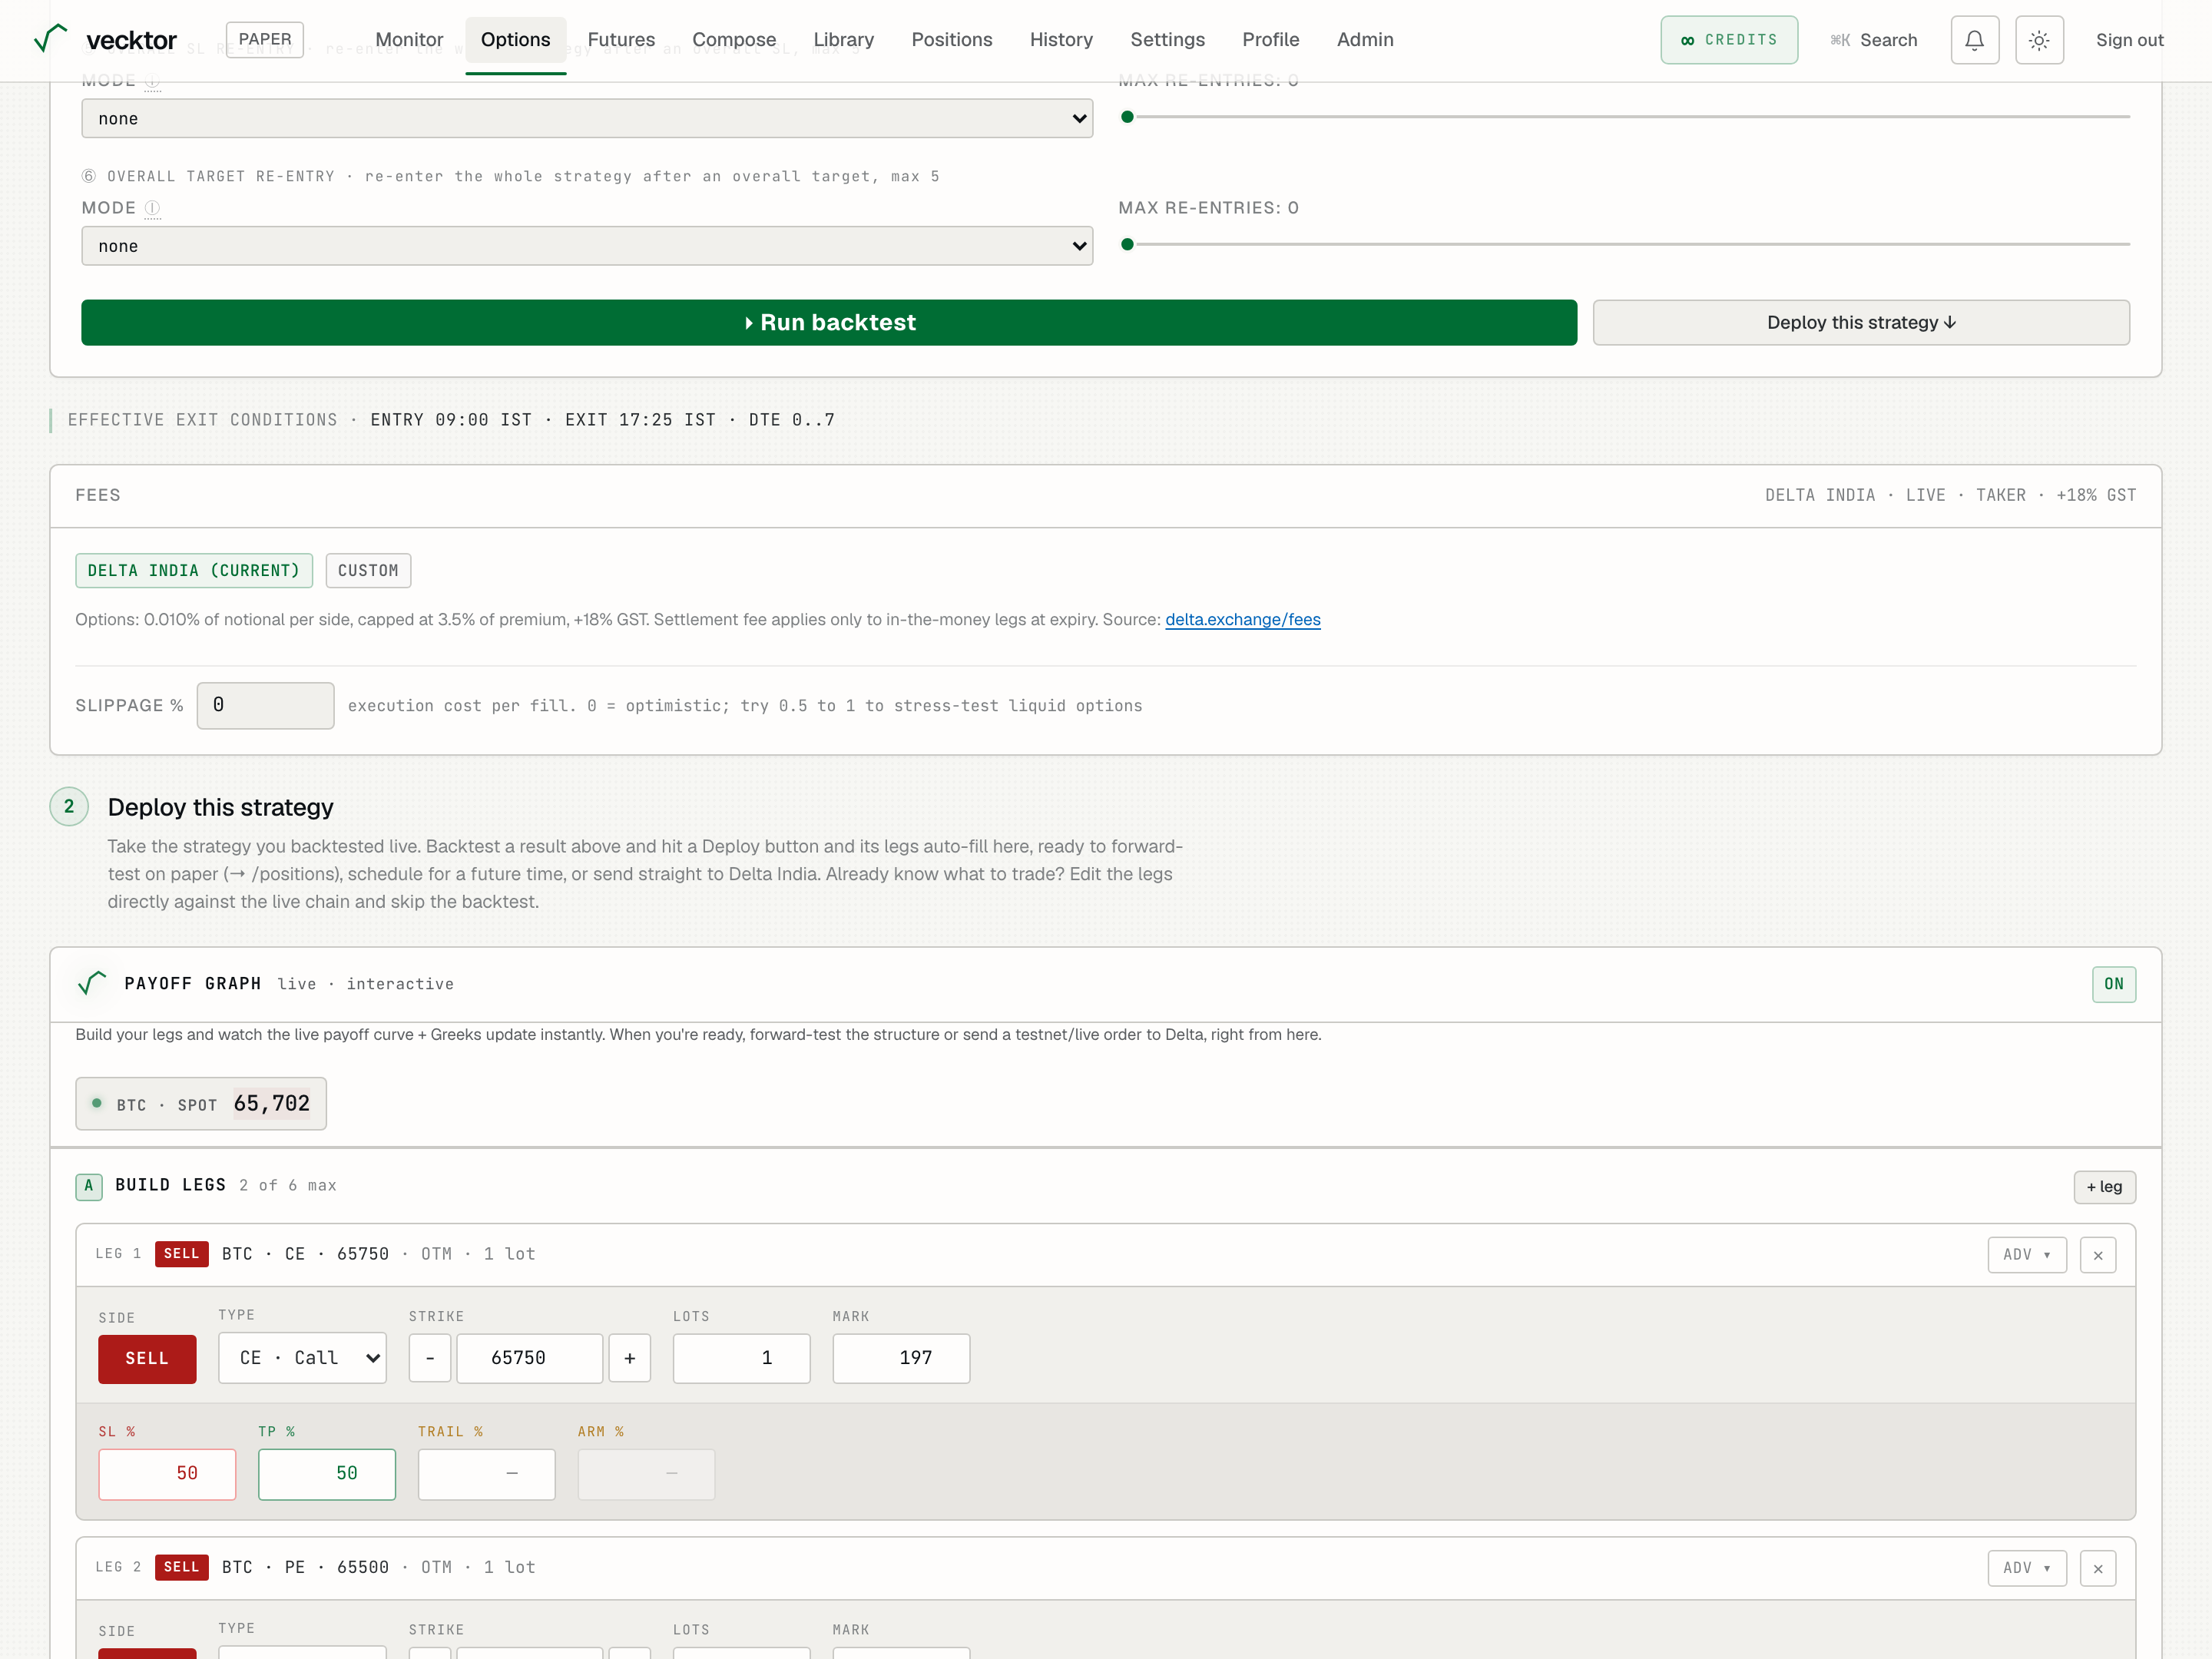
- Click Run (starts the backtest)
- Watch it fill by date
- Read any error (it says exactly what to change)
Read the results
The result panels go from a quick summary to a full breakdown.
- Read the summary: total return, total P&L, win rate, max drawdown, Sharpe.
- Check the net-of-costs callout: it shows the exact fees and slippage that were deducted.
- Read the performance metrics: for selling, judge by max loss, Calmar, and profit factor, not Sharpe alone.
- Scan the calendar heatmap, equity curve versus BTC, and the trade log to see how it behaved day to day.
- Use the AI analyst dock to ask why a month lost, or whether the result looks overfit.
- Read total return (after all costs)
- Check max drawdown (the worst peak-to-trough drop)
- See the cost callout (fees and slippage already deducted)
Build on a phone
The builder works on mobile through a compact leg drawer.
- Tap to open the leg drawer and add or edit legs one at a time.
- Set stops and targets in the same drawer.
- Run and read results in the same single-column flow.