Scan the market
The scanner reads the whole Delta India perpetuals universe (perps, the no-expiry contracts that track spot) and surfaces the coins that fit what you are looking for. This guide covers AI mode, the charts and the live scoreboard, the quick filters and presets, the results table, and how to trade or set alerts straight from a row.
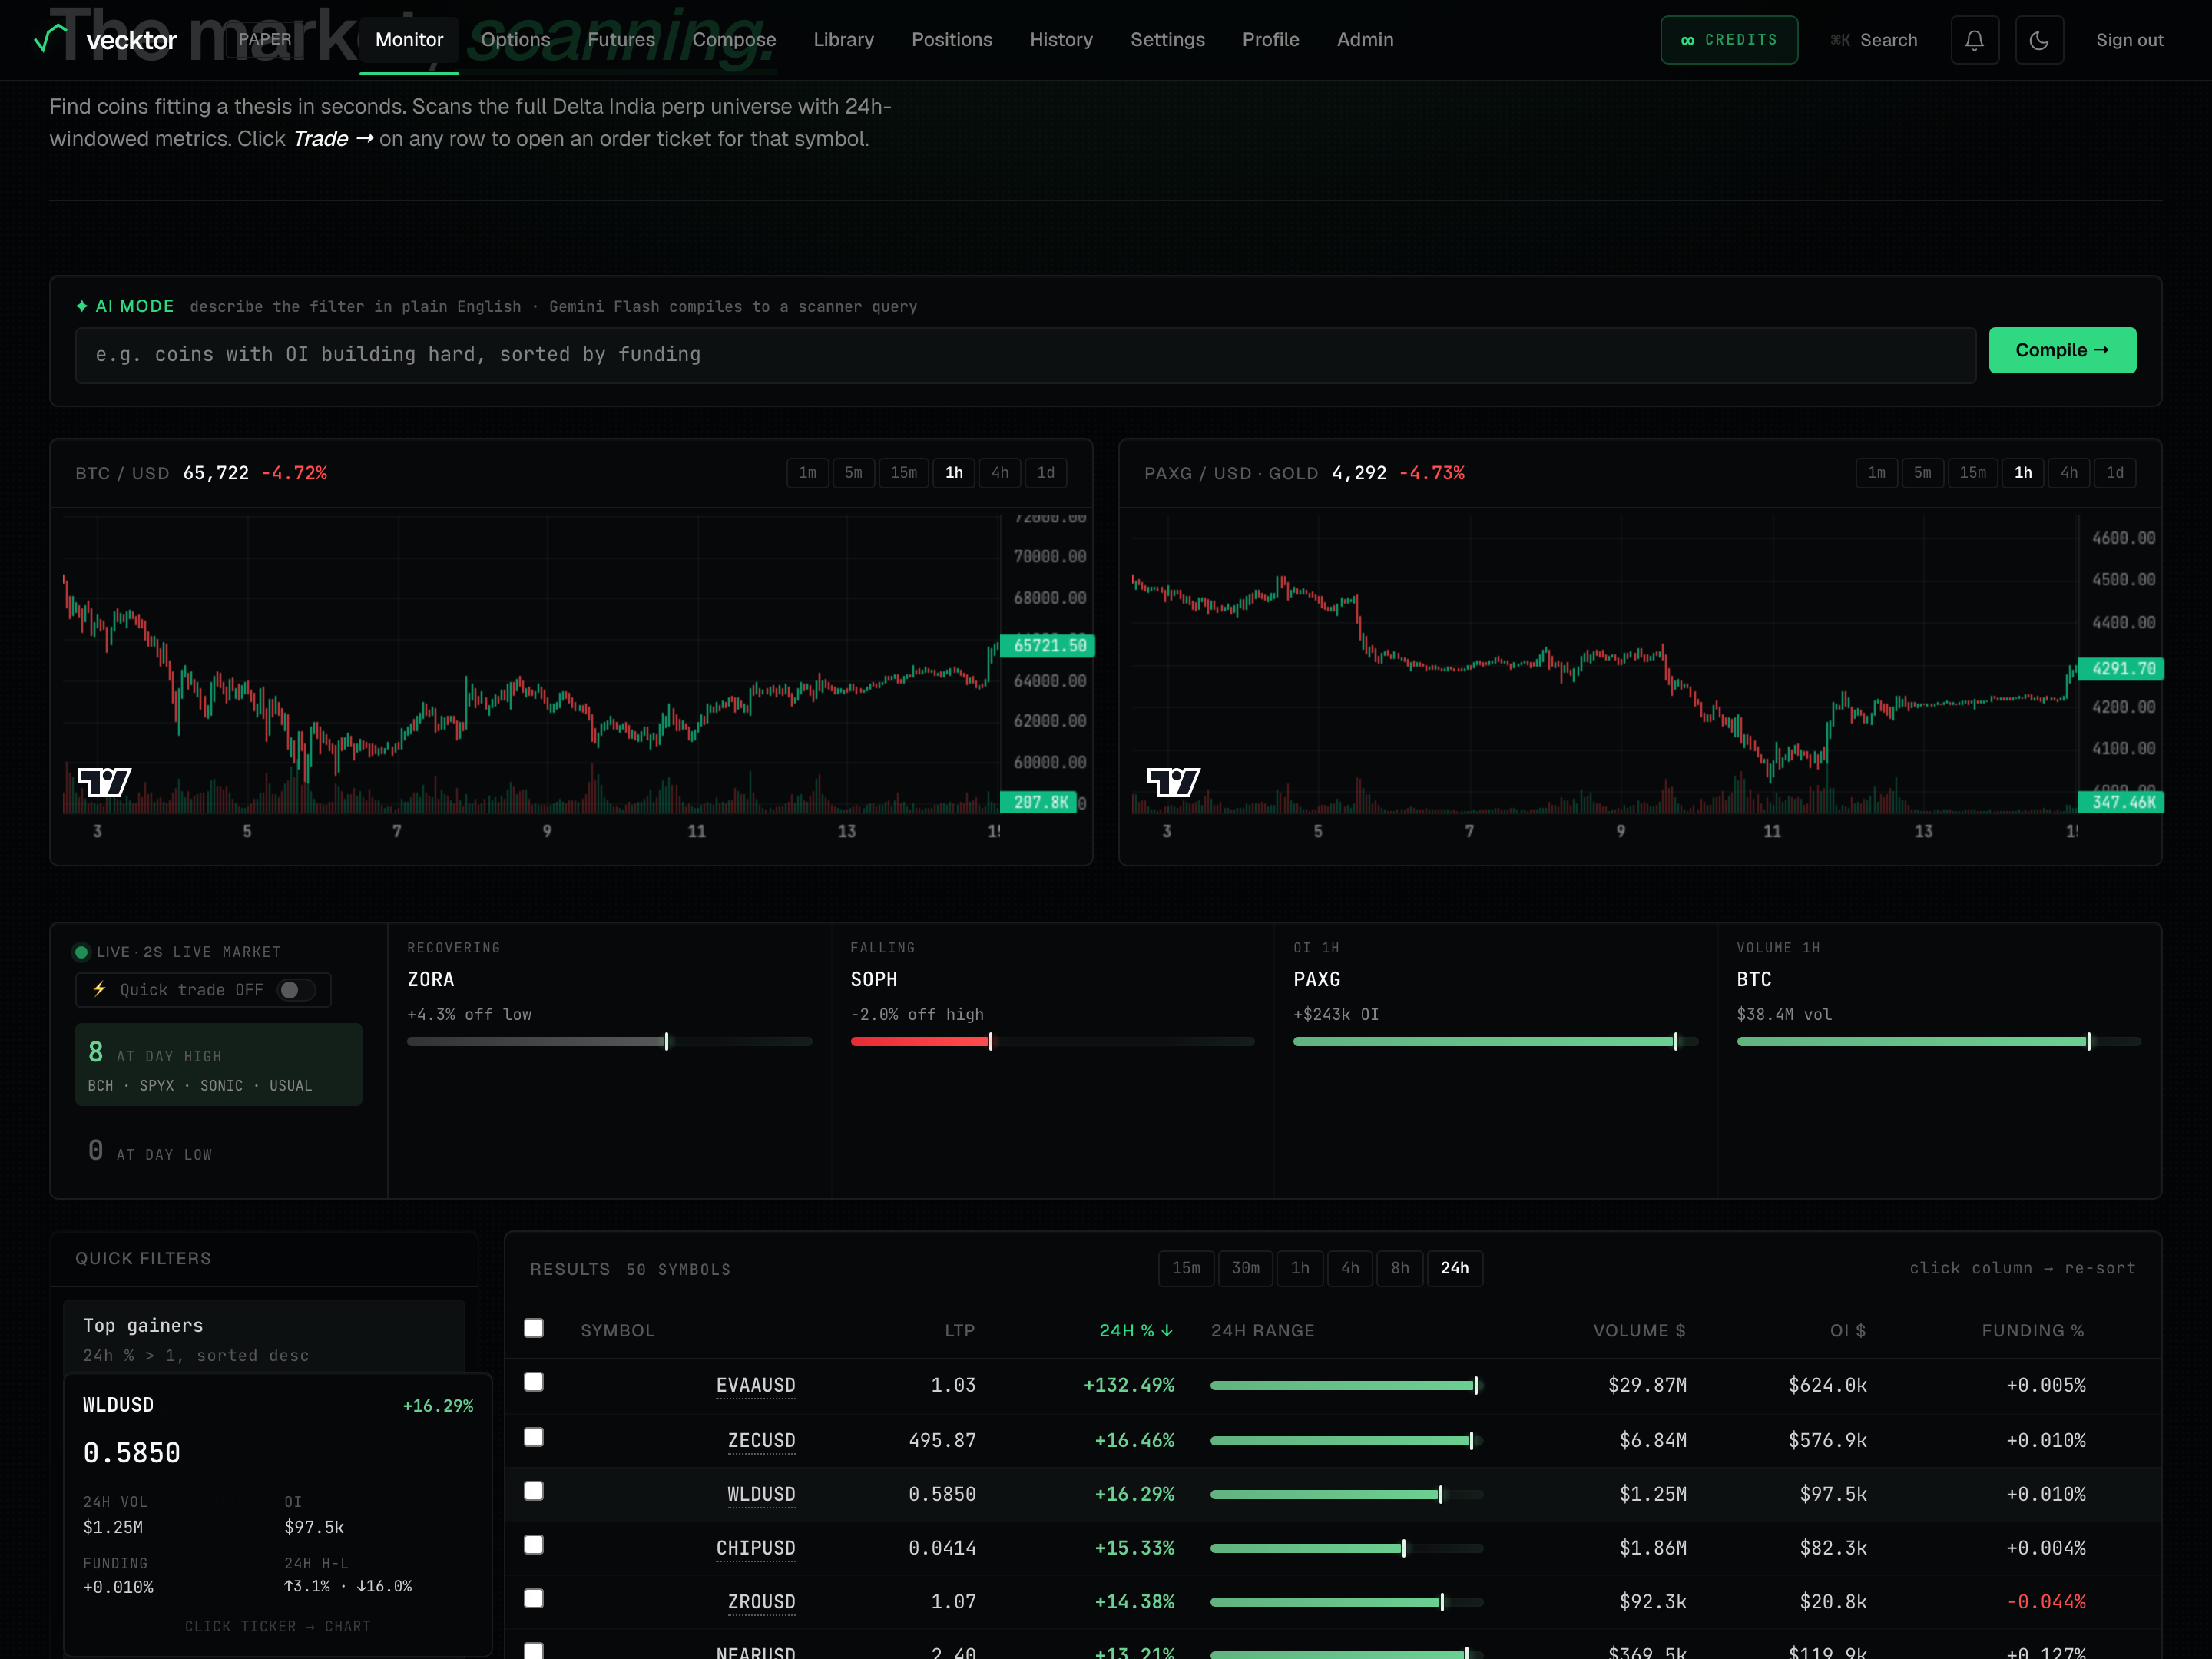
Describe the filter in plain English (AI mode)
The ✦ AI mode bar sits at the top. Type what you want in plain words and it builds the scanner query for you, then shows the matches.
- Click into the ✦ AI mode box at the top. Its placeholder reads "e.g. coins with OI building hard, sorted by funding".
- Type the thesis in plain words, for example "coins with OI building hard, sorted by funding". OI is open interest, the total money in open contracts. Funding is the small fee longs and shorts pay each other to hold a perp.
- Click Compile → , or press Enter.
- Read the "↳ matched:" line under the box. It shows in plain English what the query understood, so you can tell if it caught your intent.
 1Describe the filter in plain English2Compile the query
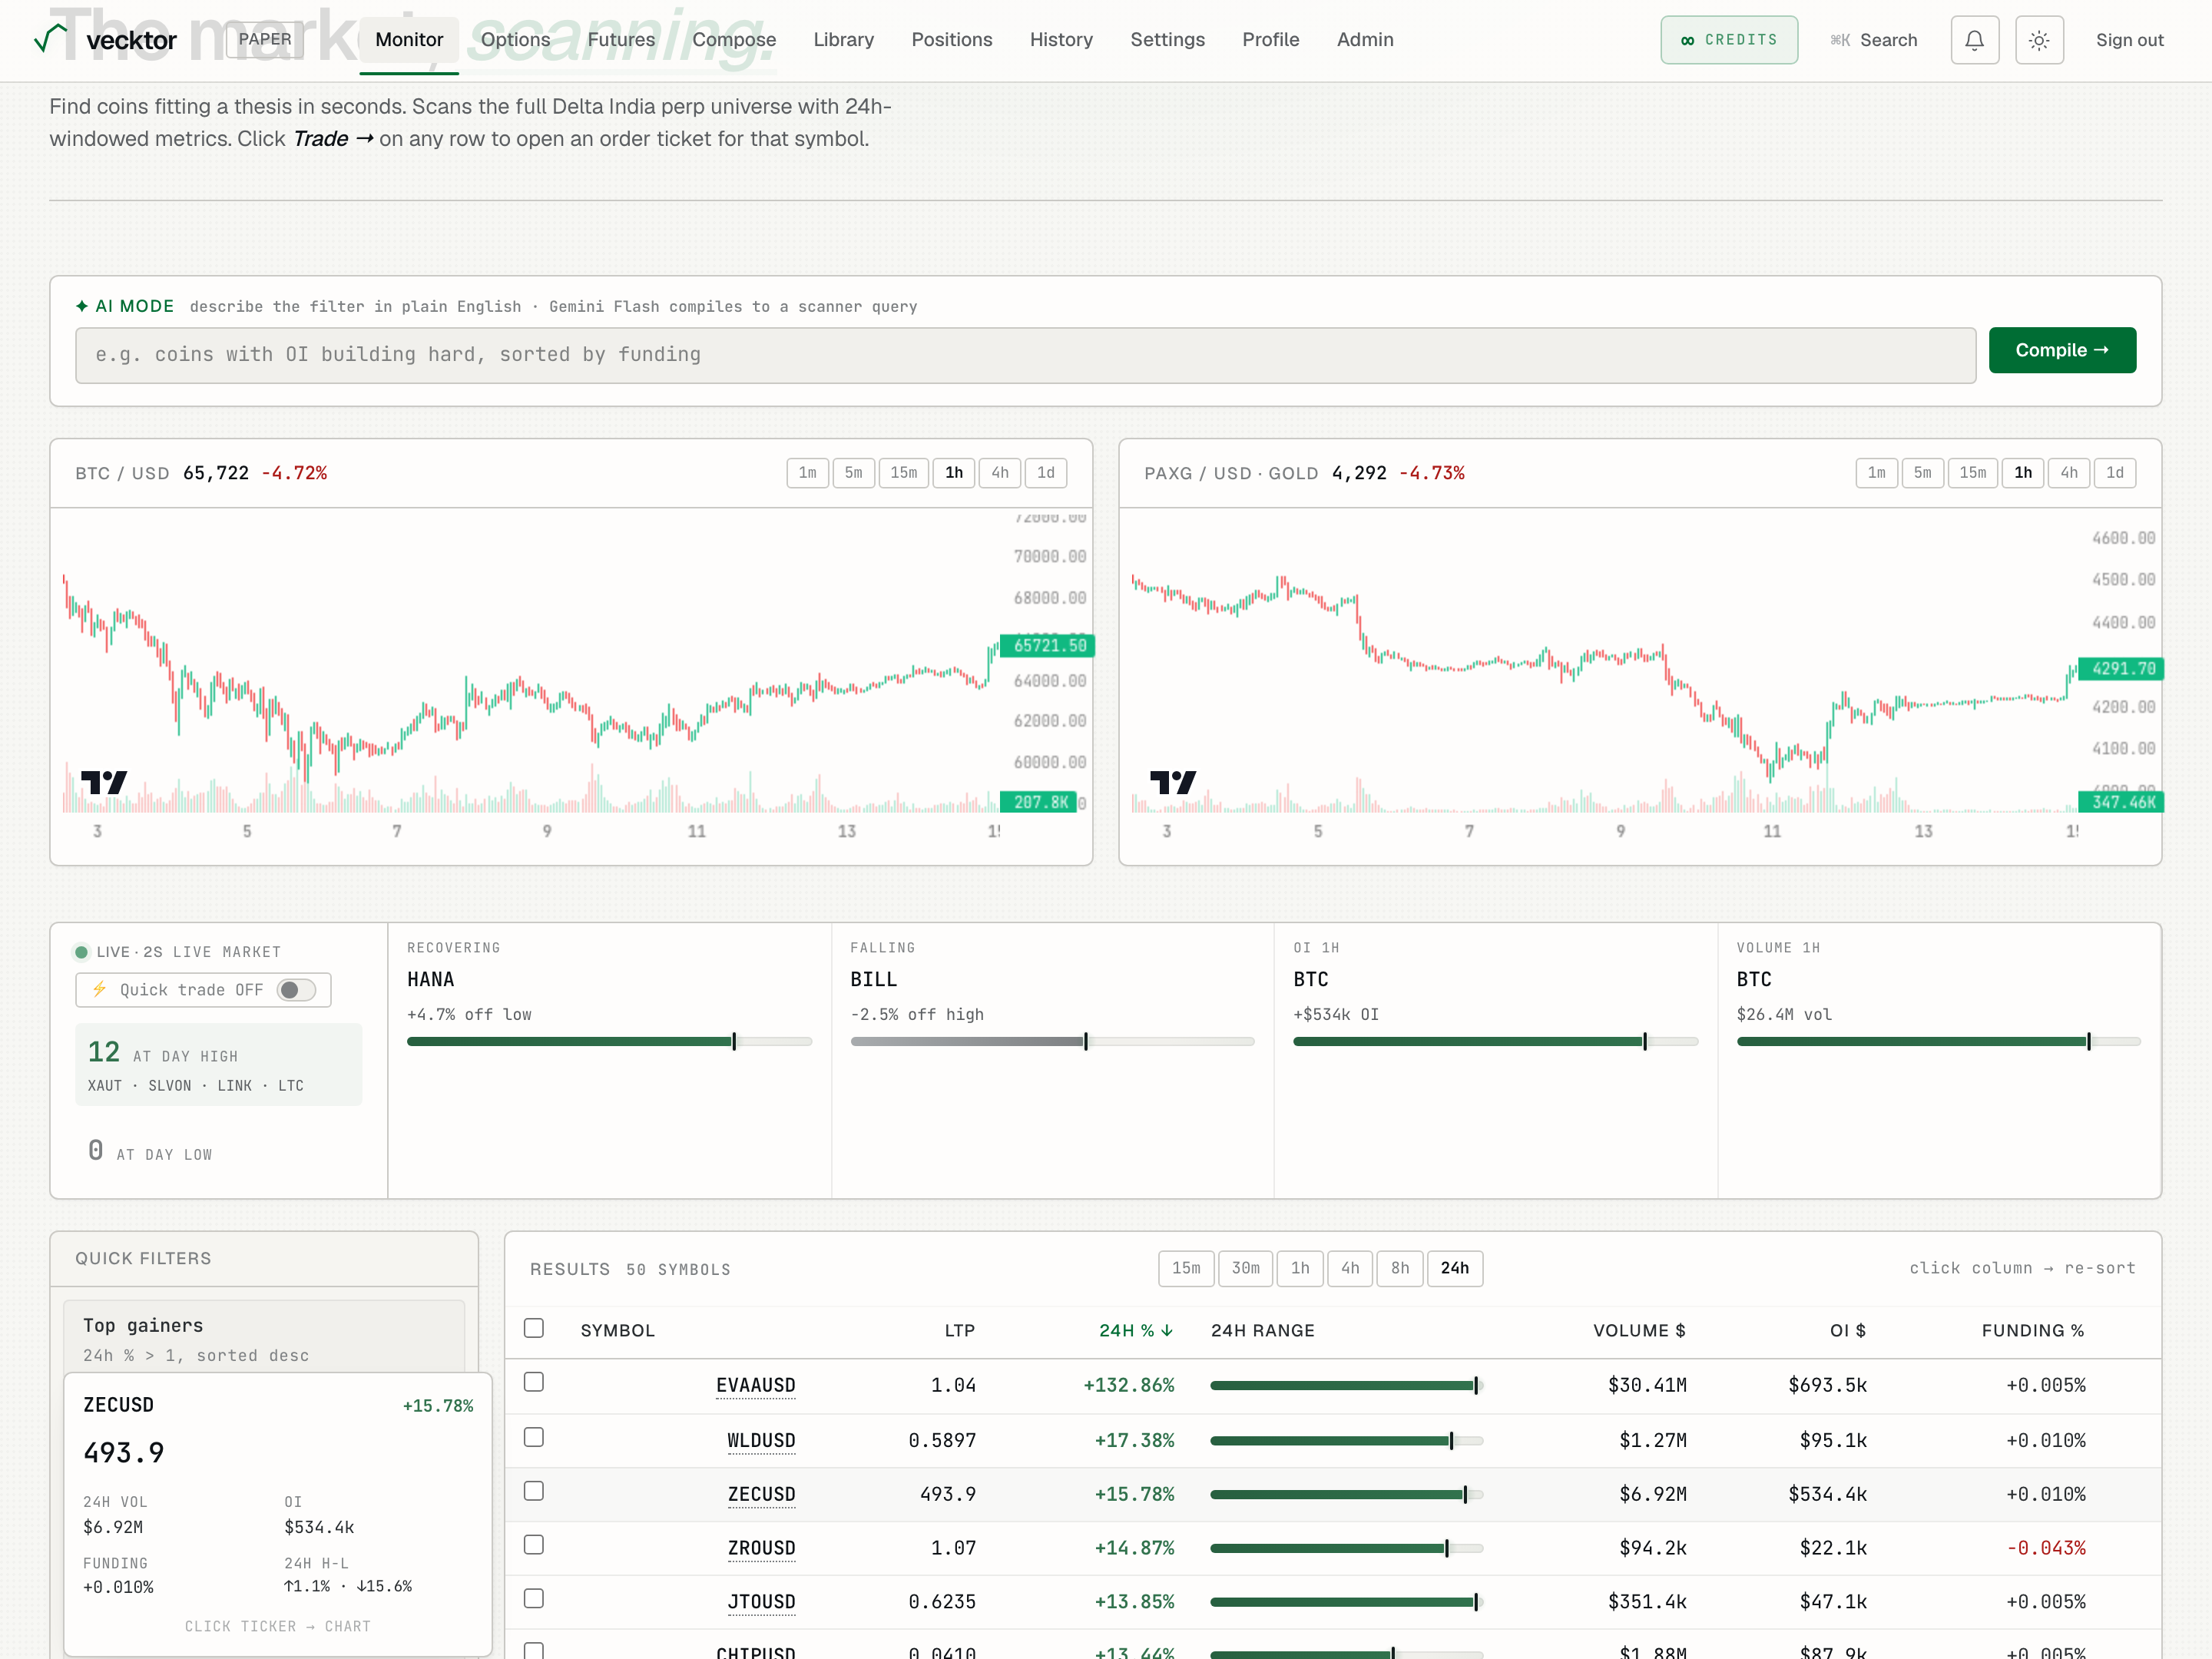
- Type the thesis in plain words (no filter knobs needed)
- Click Compile → or press Enter (builds the scanner query)
- Read the ↳ matched line (check it caught your intent)
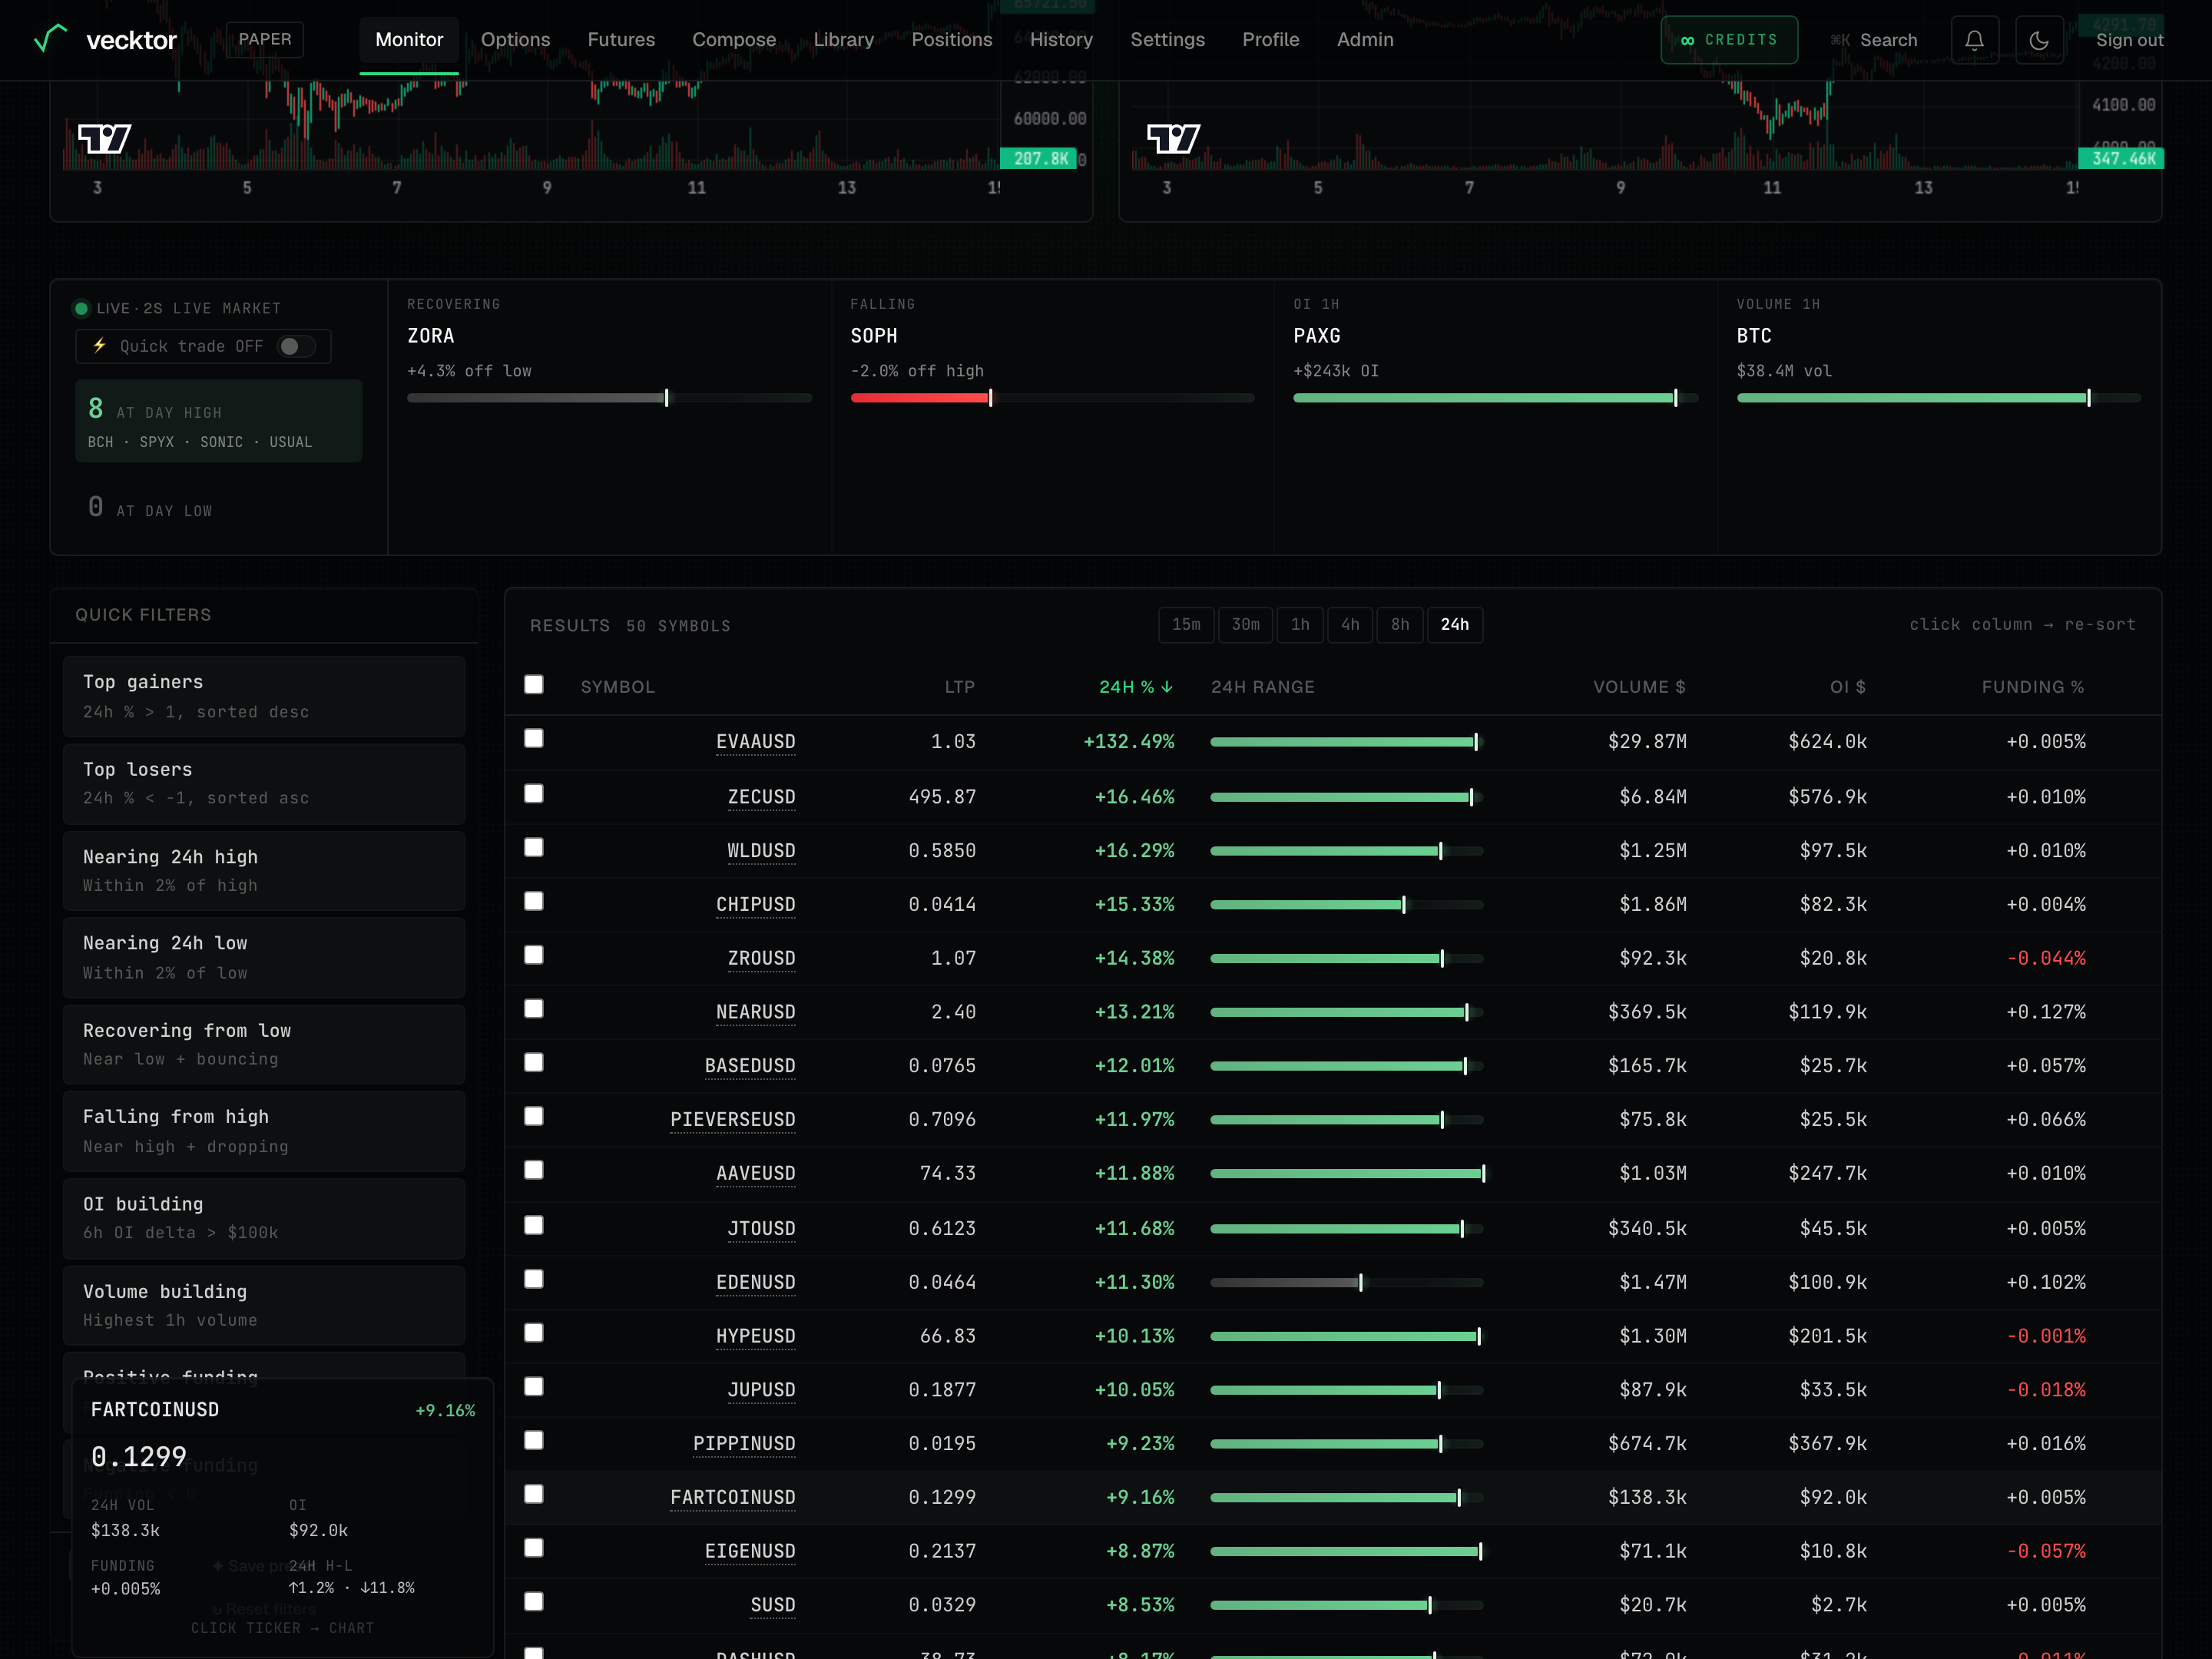
Read the BTC and gold charts
Two price charts sit under the AI bar, labelled BTC / USD on the left and PAXG / USD · gold (a gold-backed coin) on the right. They are drawn from our own Delta candle data, not an outside feed.
- Glance at the BTC / USD chart for where the market is leaning right now.
- Glance at the PAXG / USD · gold chart next to it for the risk-off side.
- Use them as context before you act on a scanner row.
Watch the live scoreboard banner
The banner under the charts is an auto, no-setup readout that tracks the market like a live score. It refreshes on its own about every minute.
- Read the At day high and At day low counters on the left. These count how many coins are sitting right at their high or low for the day.
- Read the four leader tiles: Recovering (near its day low and bouncing), Falling (near its day high and rolling over), OI 1h (biggest open-interest gain in the last hour), and Volume 1h (most traded in the last hour).
- Note the price-position bar on each leader tile. It shows where the last price sits between the day low and the day high.
 1Coins at their day high / low2Leader tiles (Recovering / Falling / OI / Volume)
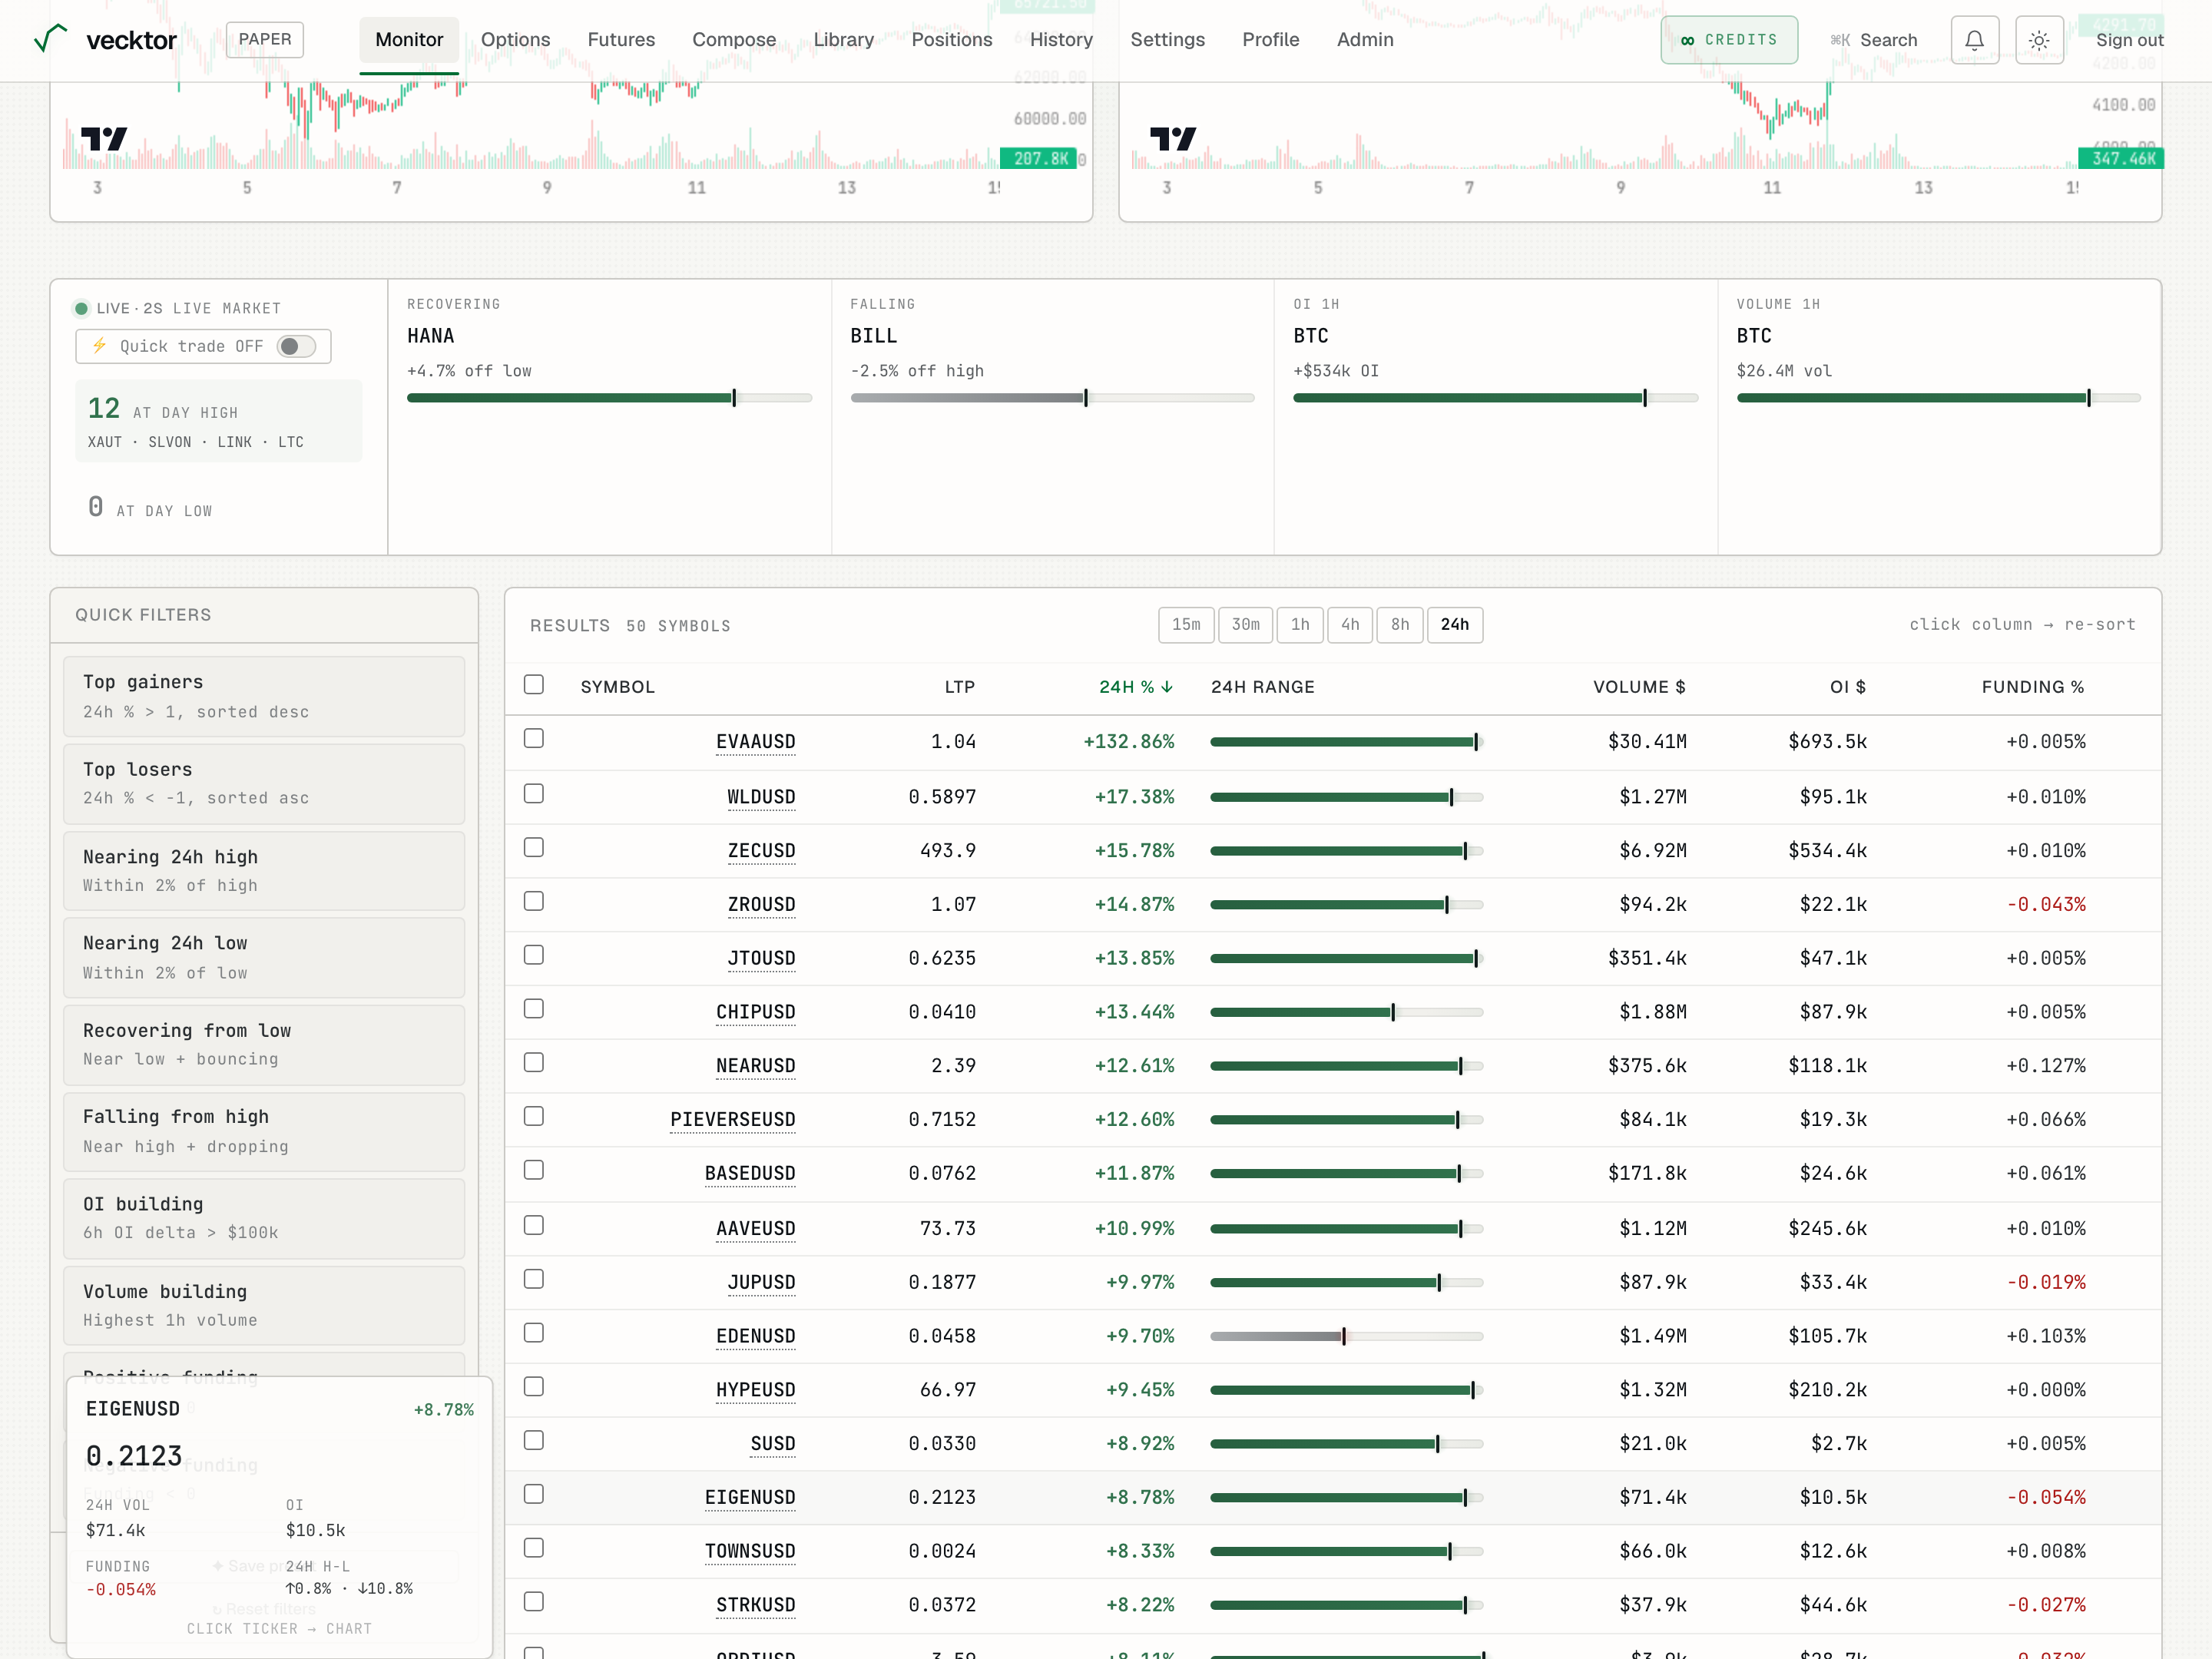
Turn on quick trade and set your lots
The ⚡ Quick trade toggle is a gate. While it reads OFF, the scanner is watch-only. Turn it on to place orders straight from a row or a scoreboard tile. The toggle lives in the scoreboard banner, next to the Live market label.
- Find the toggle reading ⚡ Quick trade OFF in the banner and click it. It flips to ⚡ Quick trade ON in place.
- Set the Lots field that appears next to the toggle. Lots is your default size, and it prefills each order ticket (you can still change it per trade).
- Notice the Trade → buttons now appear on every results row and on the scoreboard tiles.
- Click the toggle again any time to go back to watch-only.
 1Quick trade gate (OFF is watch-only)
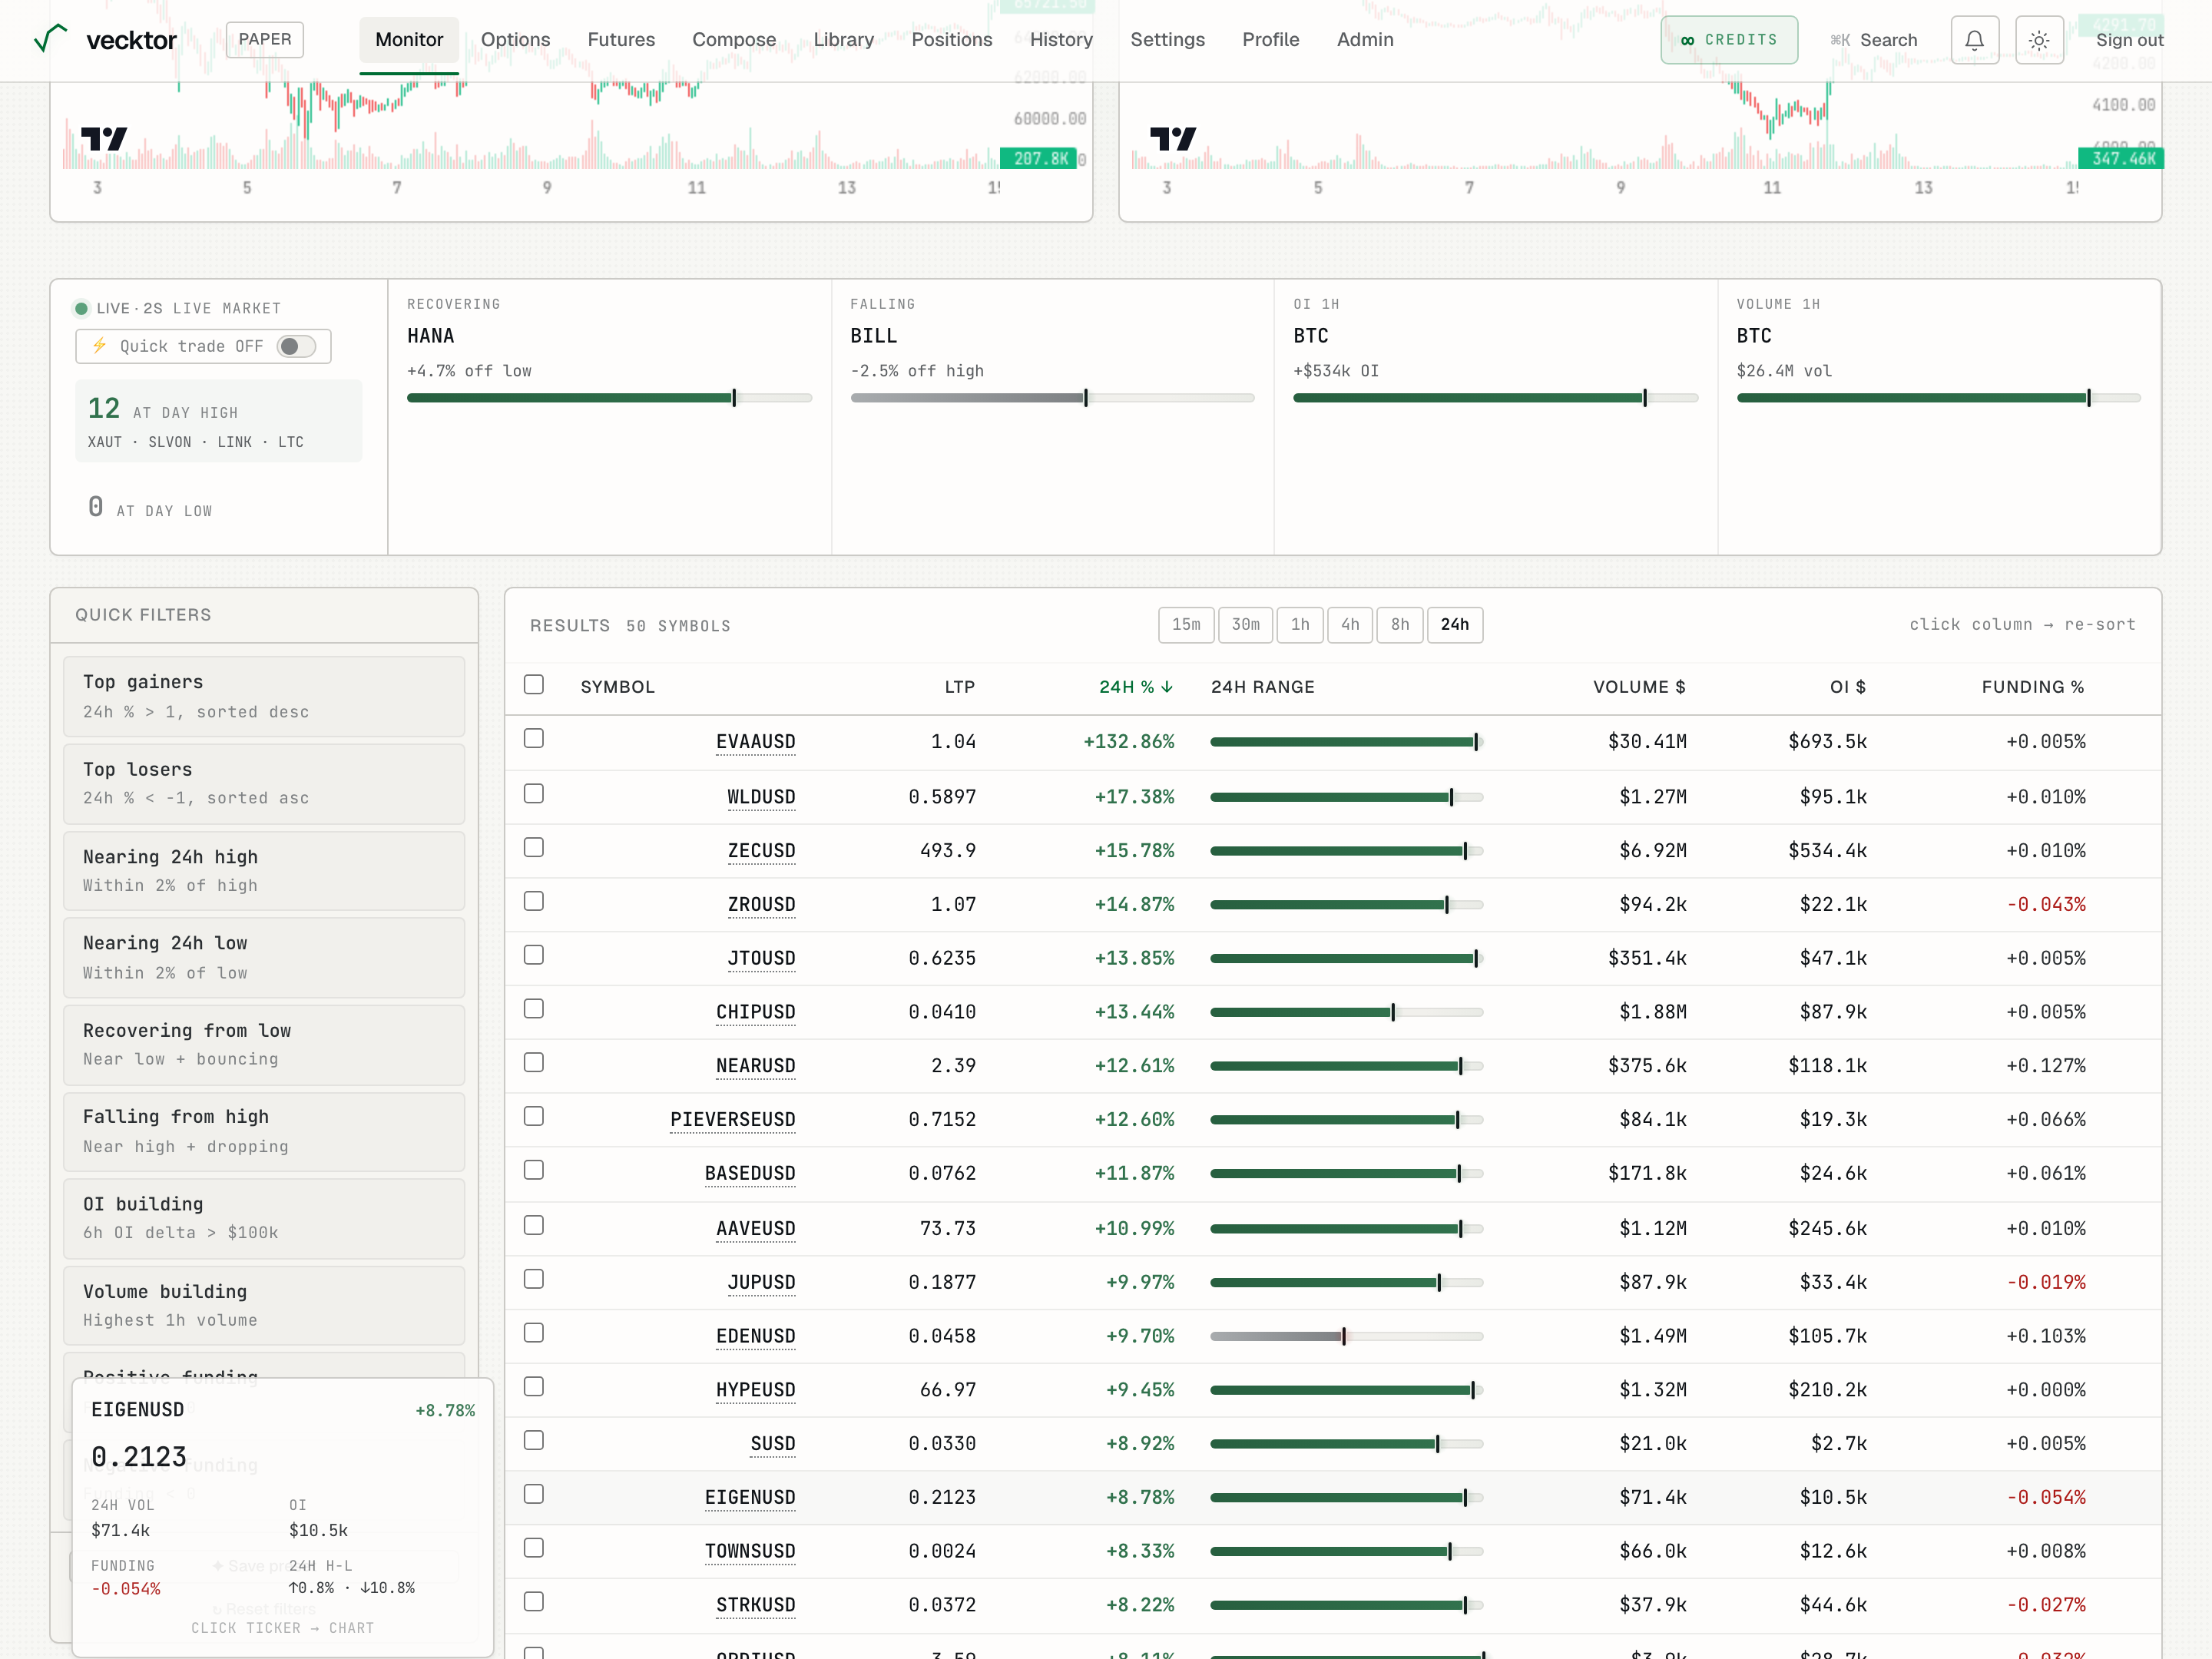
- Click to flip it ON (shows the Trade → buttons)
- Set your default lots (prefills each order ticket)
- A Trade → button appears per row (opens an order ticket)
- Confirm your size first (these are real live orders)
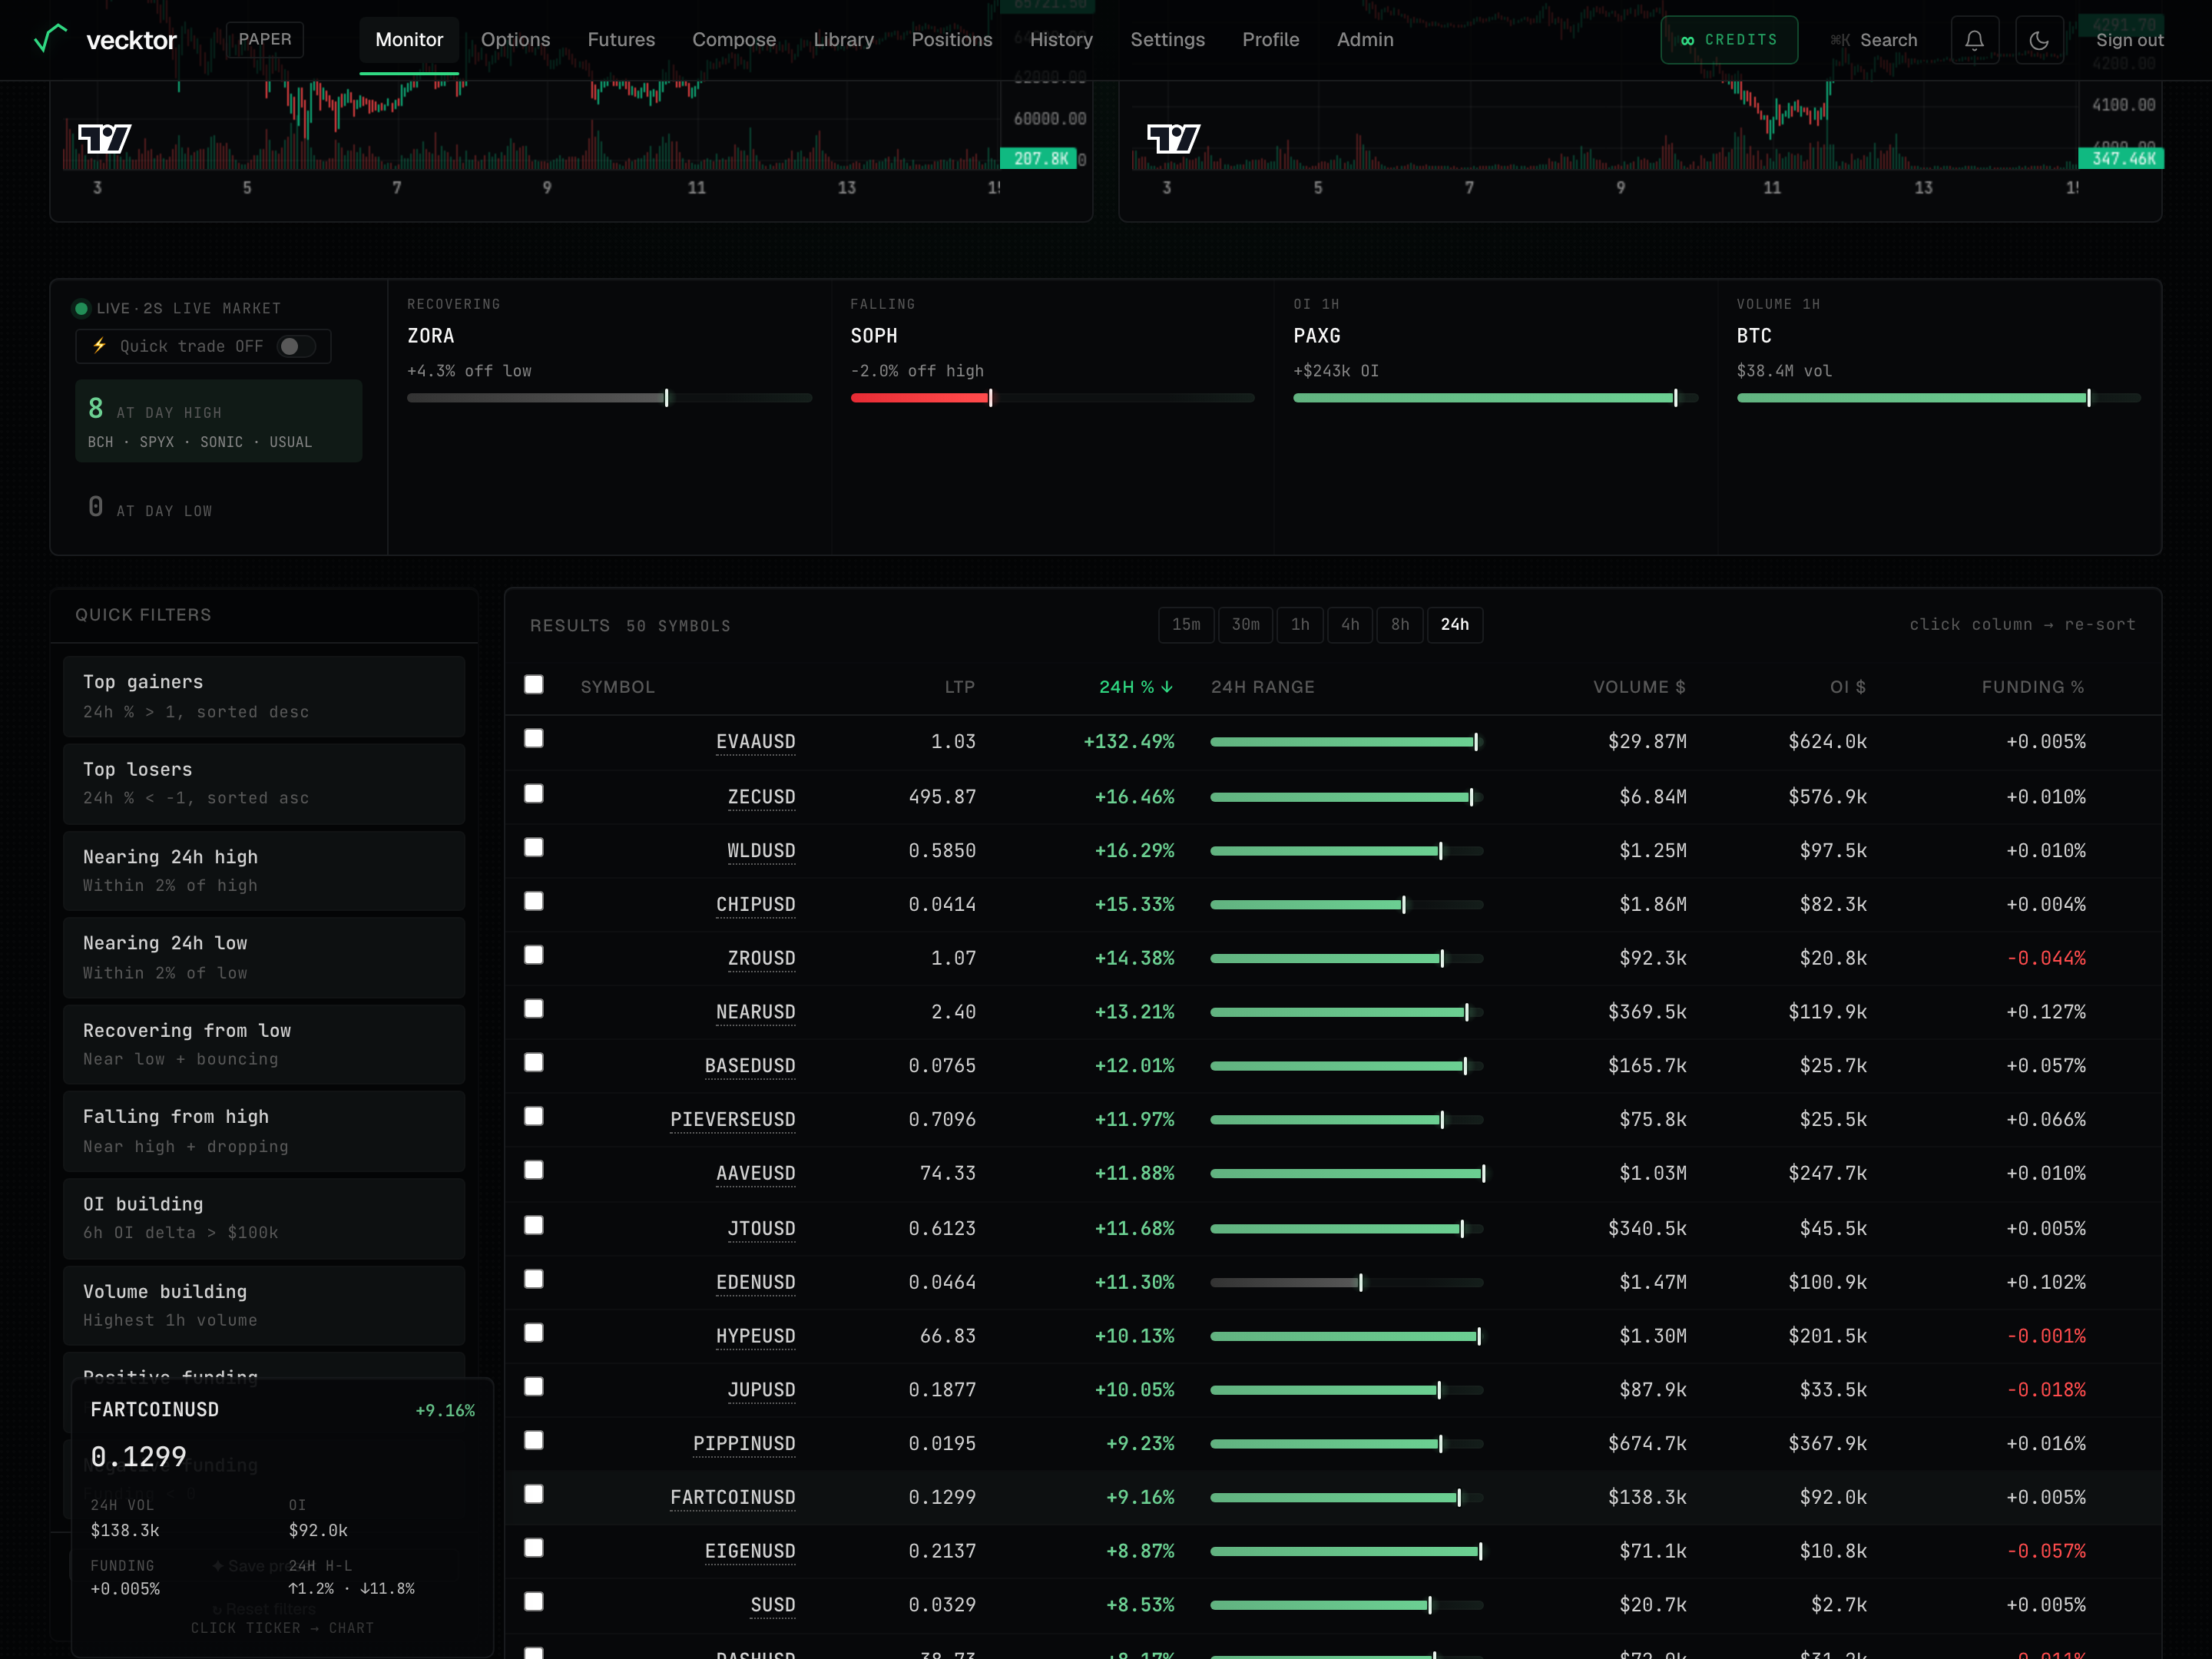
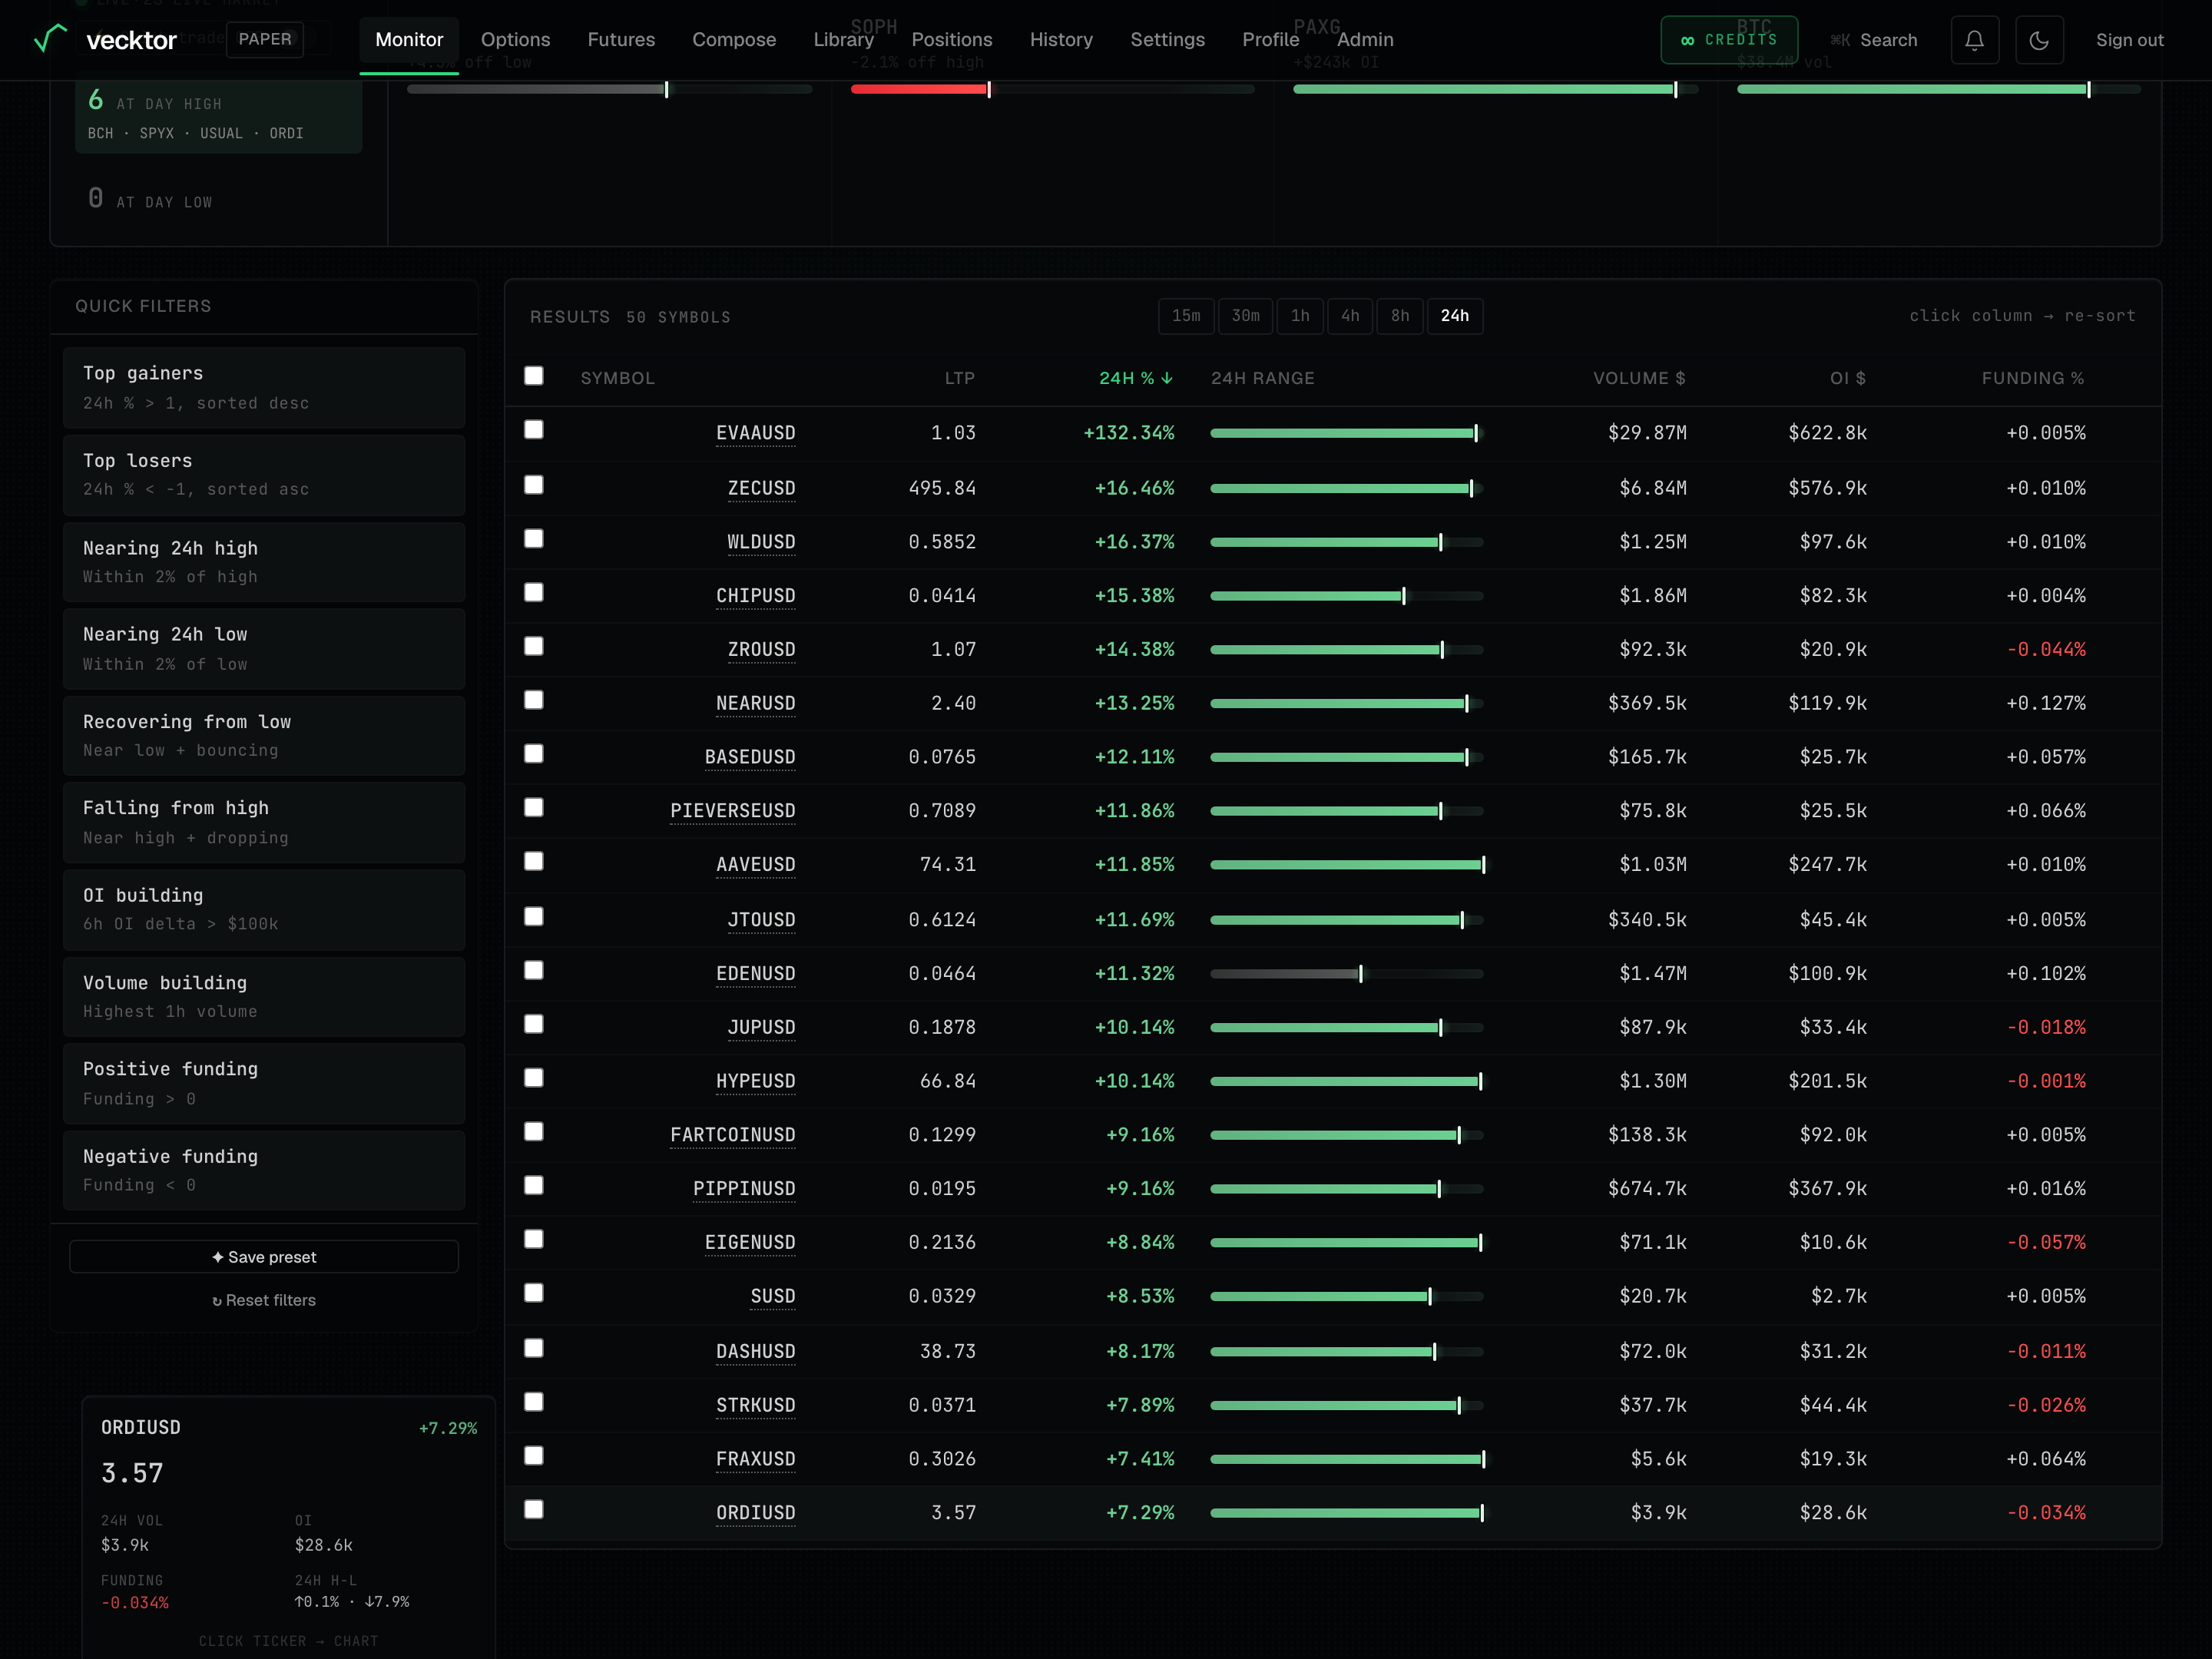
Use the one-click quick filters
The Quick filters rail on the left turns the most common scanner intents into one click. Clicking one resets the filter first, so two presets never stack.
- Pick a preset such as Top gainers, Top losers, Nearing 24h high, Nearing 24h low, Recovering from low, Falling from high, OI building, Volume building, Positive funding, or Negative funding.
- Read the small hint under each label. It says what the preset actually filters and sorts by.
- Watch the results table refresh to the matches.
- Click a different preset to swap to it. The earlier one is cleared, not added to.
 1One-click quick filters2Each preset resets the rest
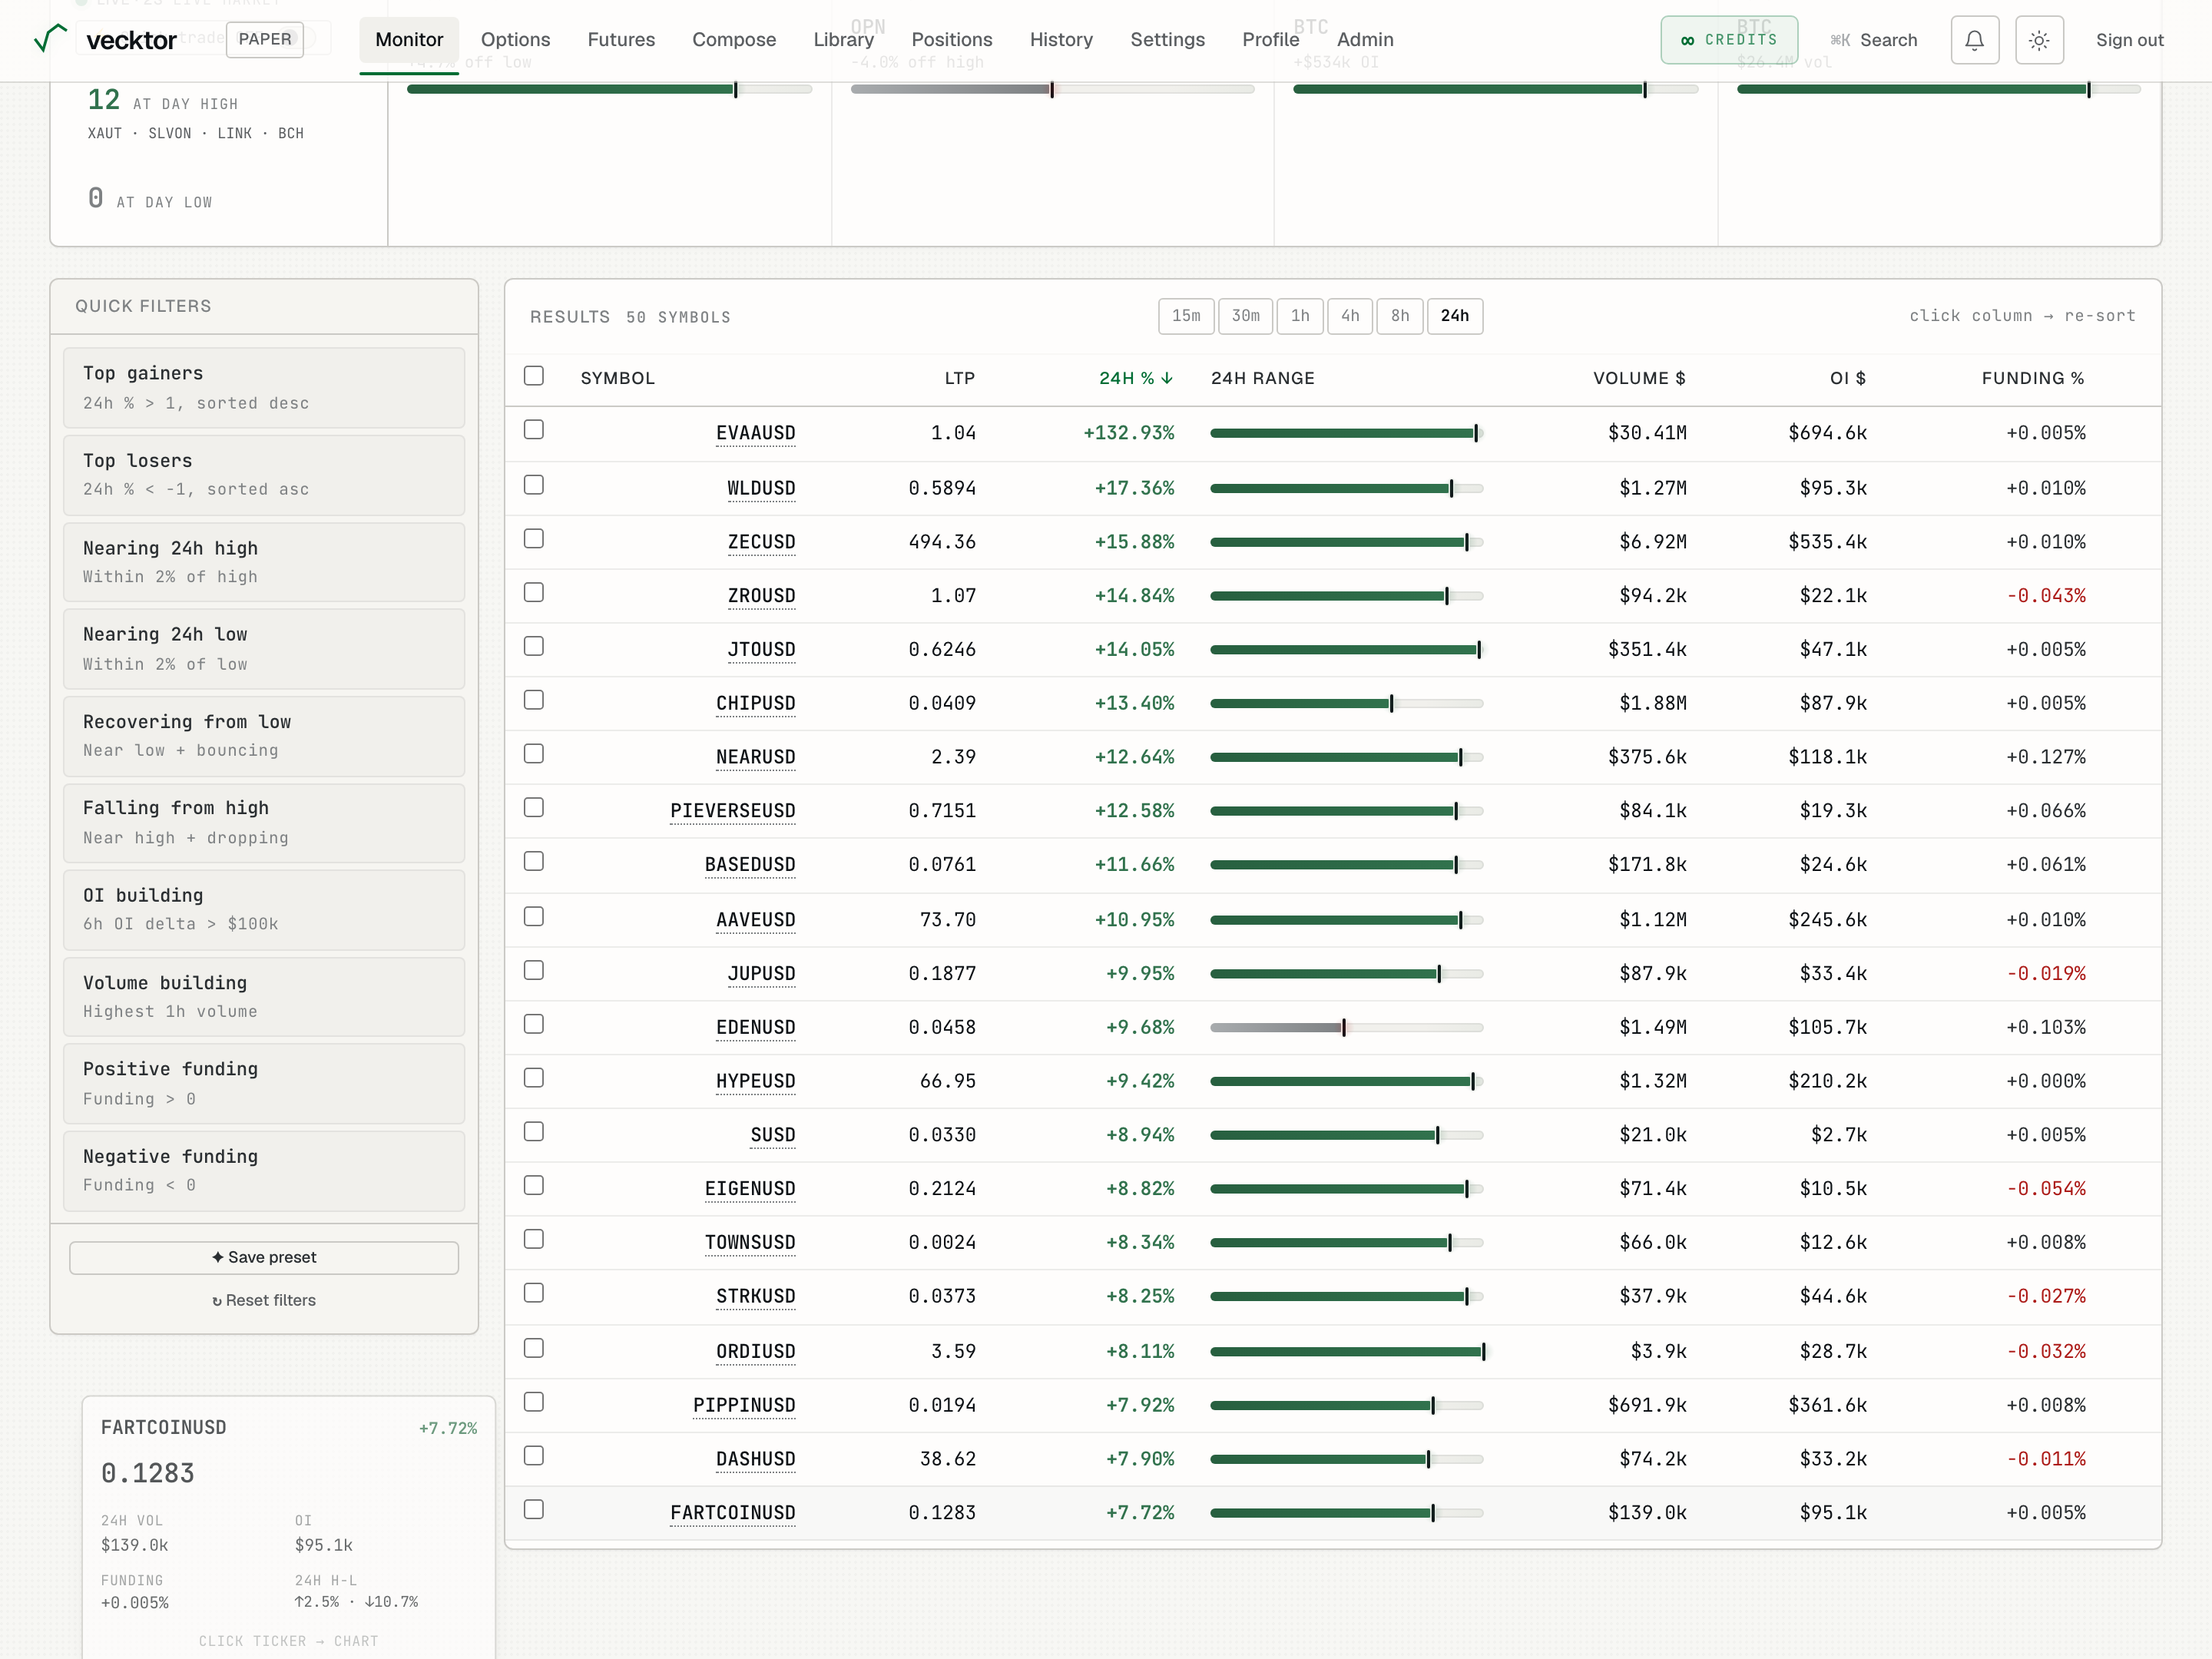
- Click a preset like OI building (applies it and clears any earlier one)
- Click ✦ Save preset and name it (follows you to another device)
- Click ↻ Reset filters to start over (back to the default view)
Save, recall, delete and reset presets
Once you have a filter you like, you can save it under a name. Saved presets are stored to your account, so they follow you to another device. You can keep up to 12.
- Click ✦ Save preset at the bottom of the rail, type a name in the preset name box, and click Save.
- Recall a saved preset later by clicking its name chip under Your presets.
- Delete a saved preset by clicking the small × on its chip.
- Click ↻ Reset filters at any time to clear everything back to the default view.
 1Save the current filter (max 12)2Clear back to the default
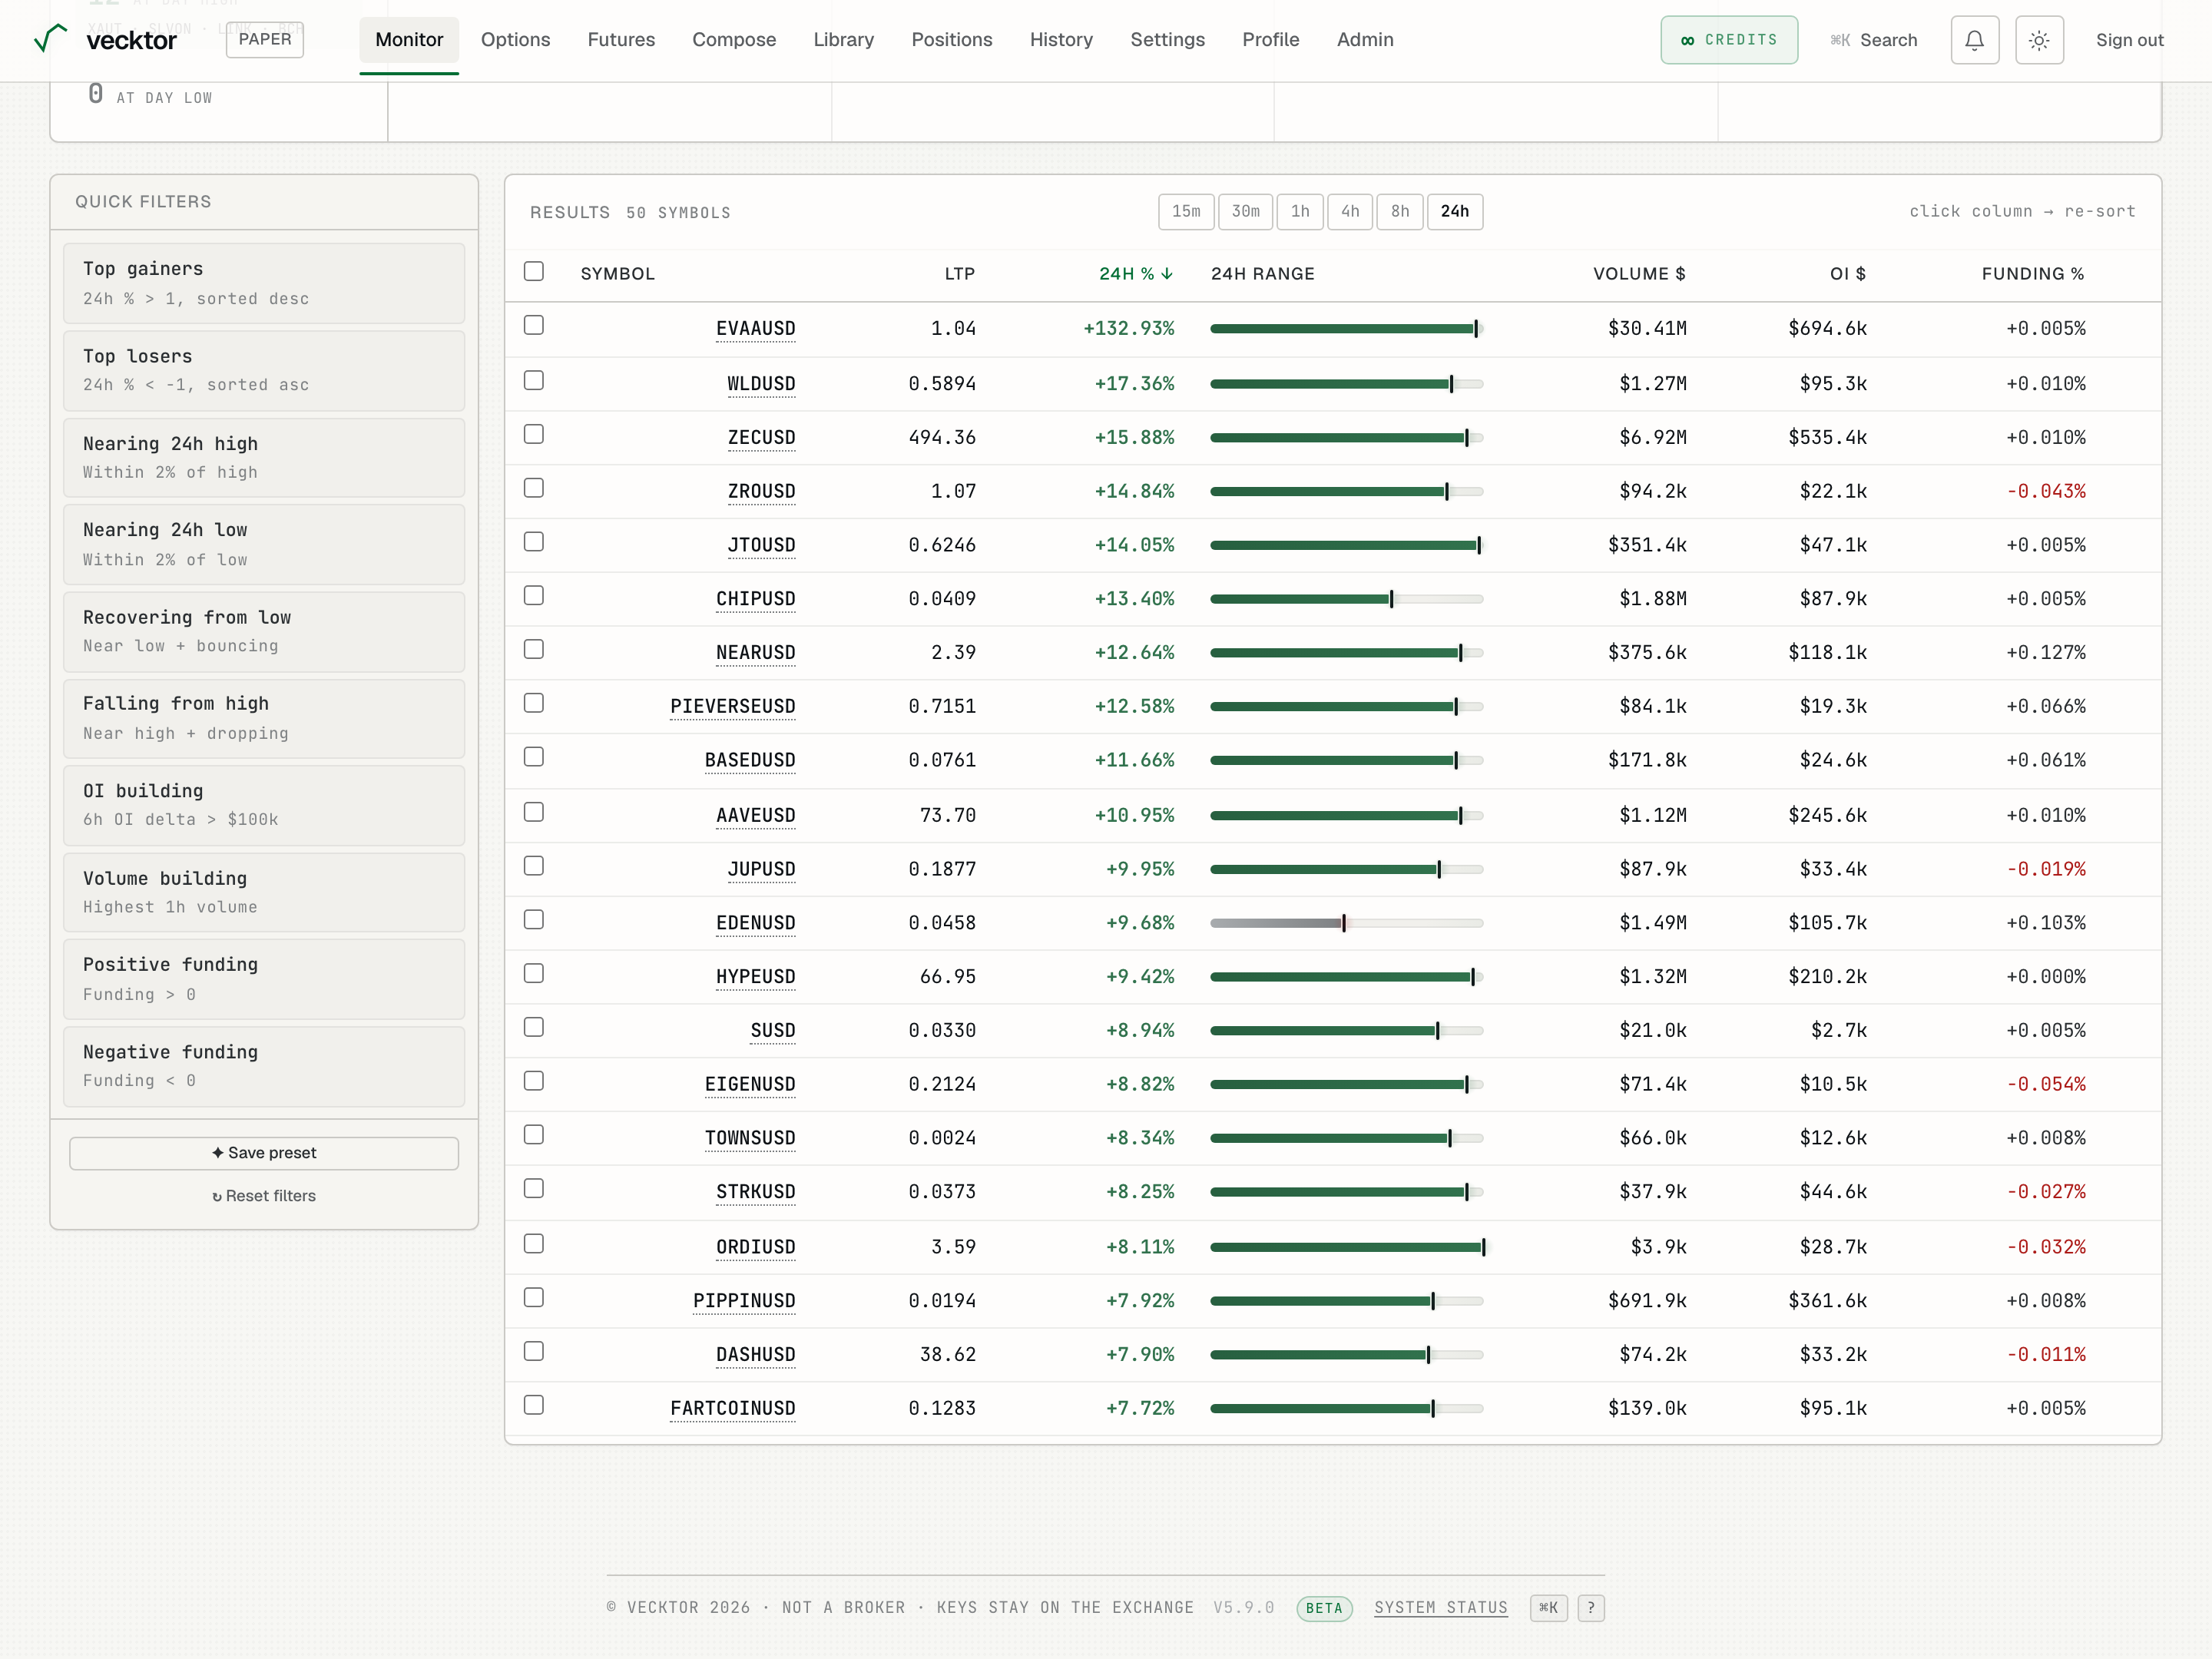
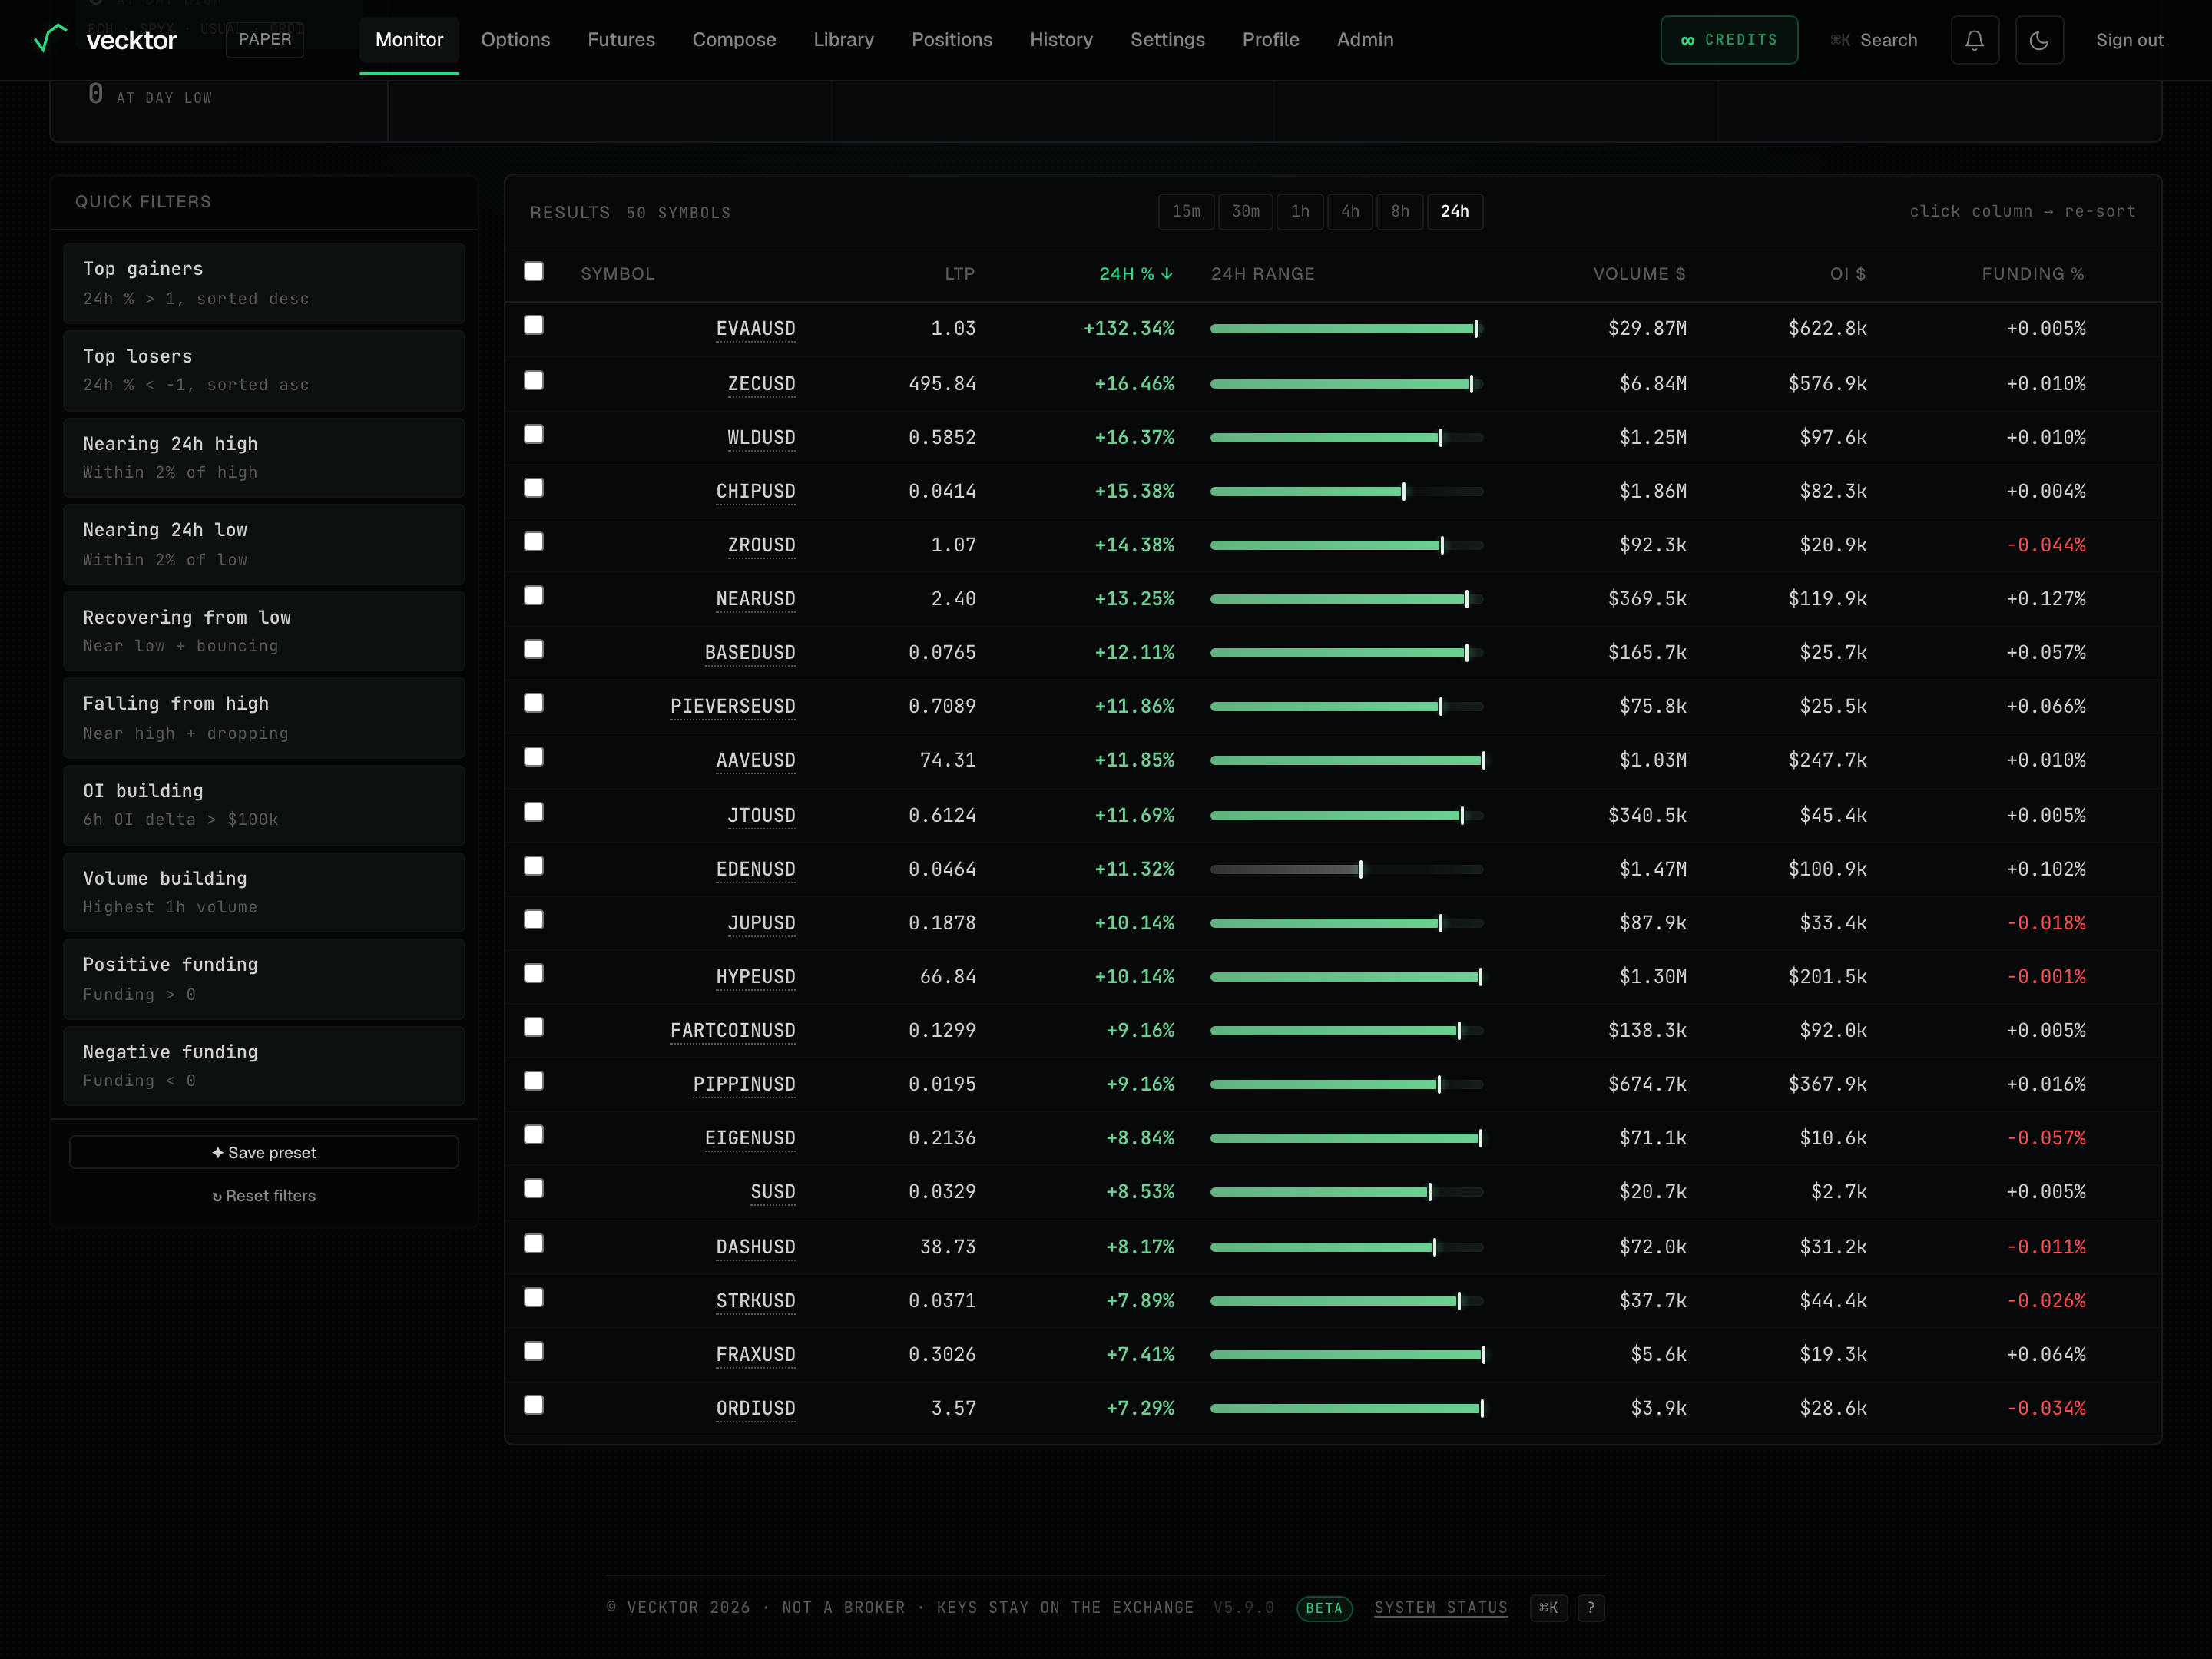
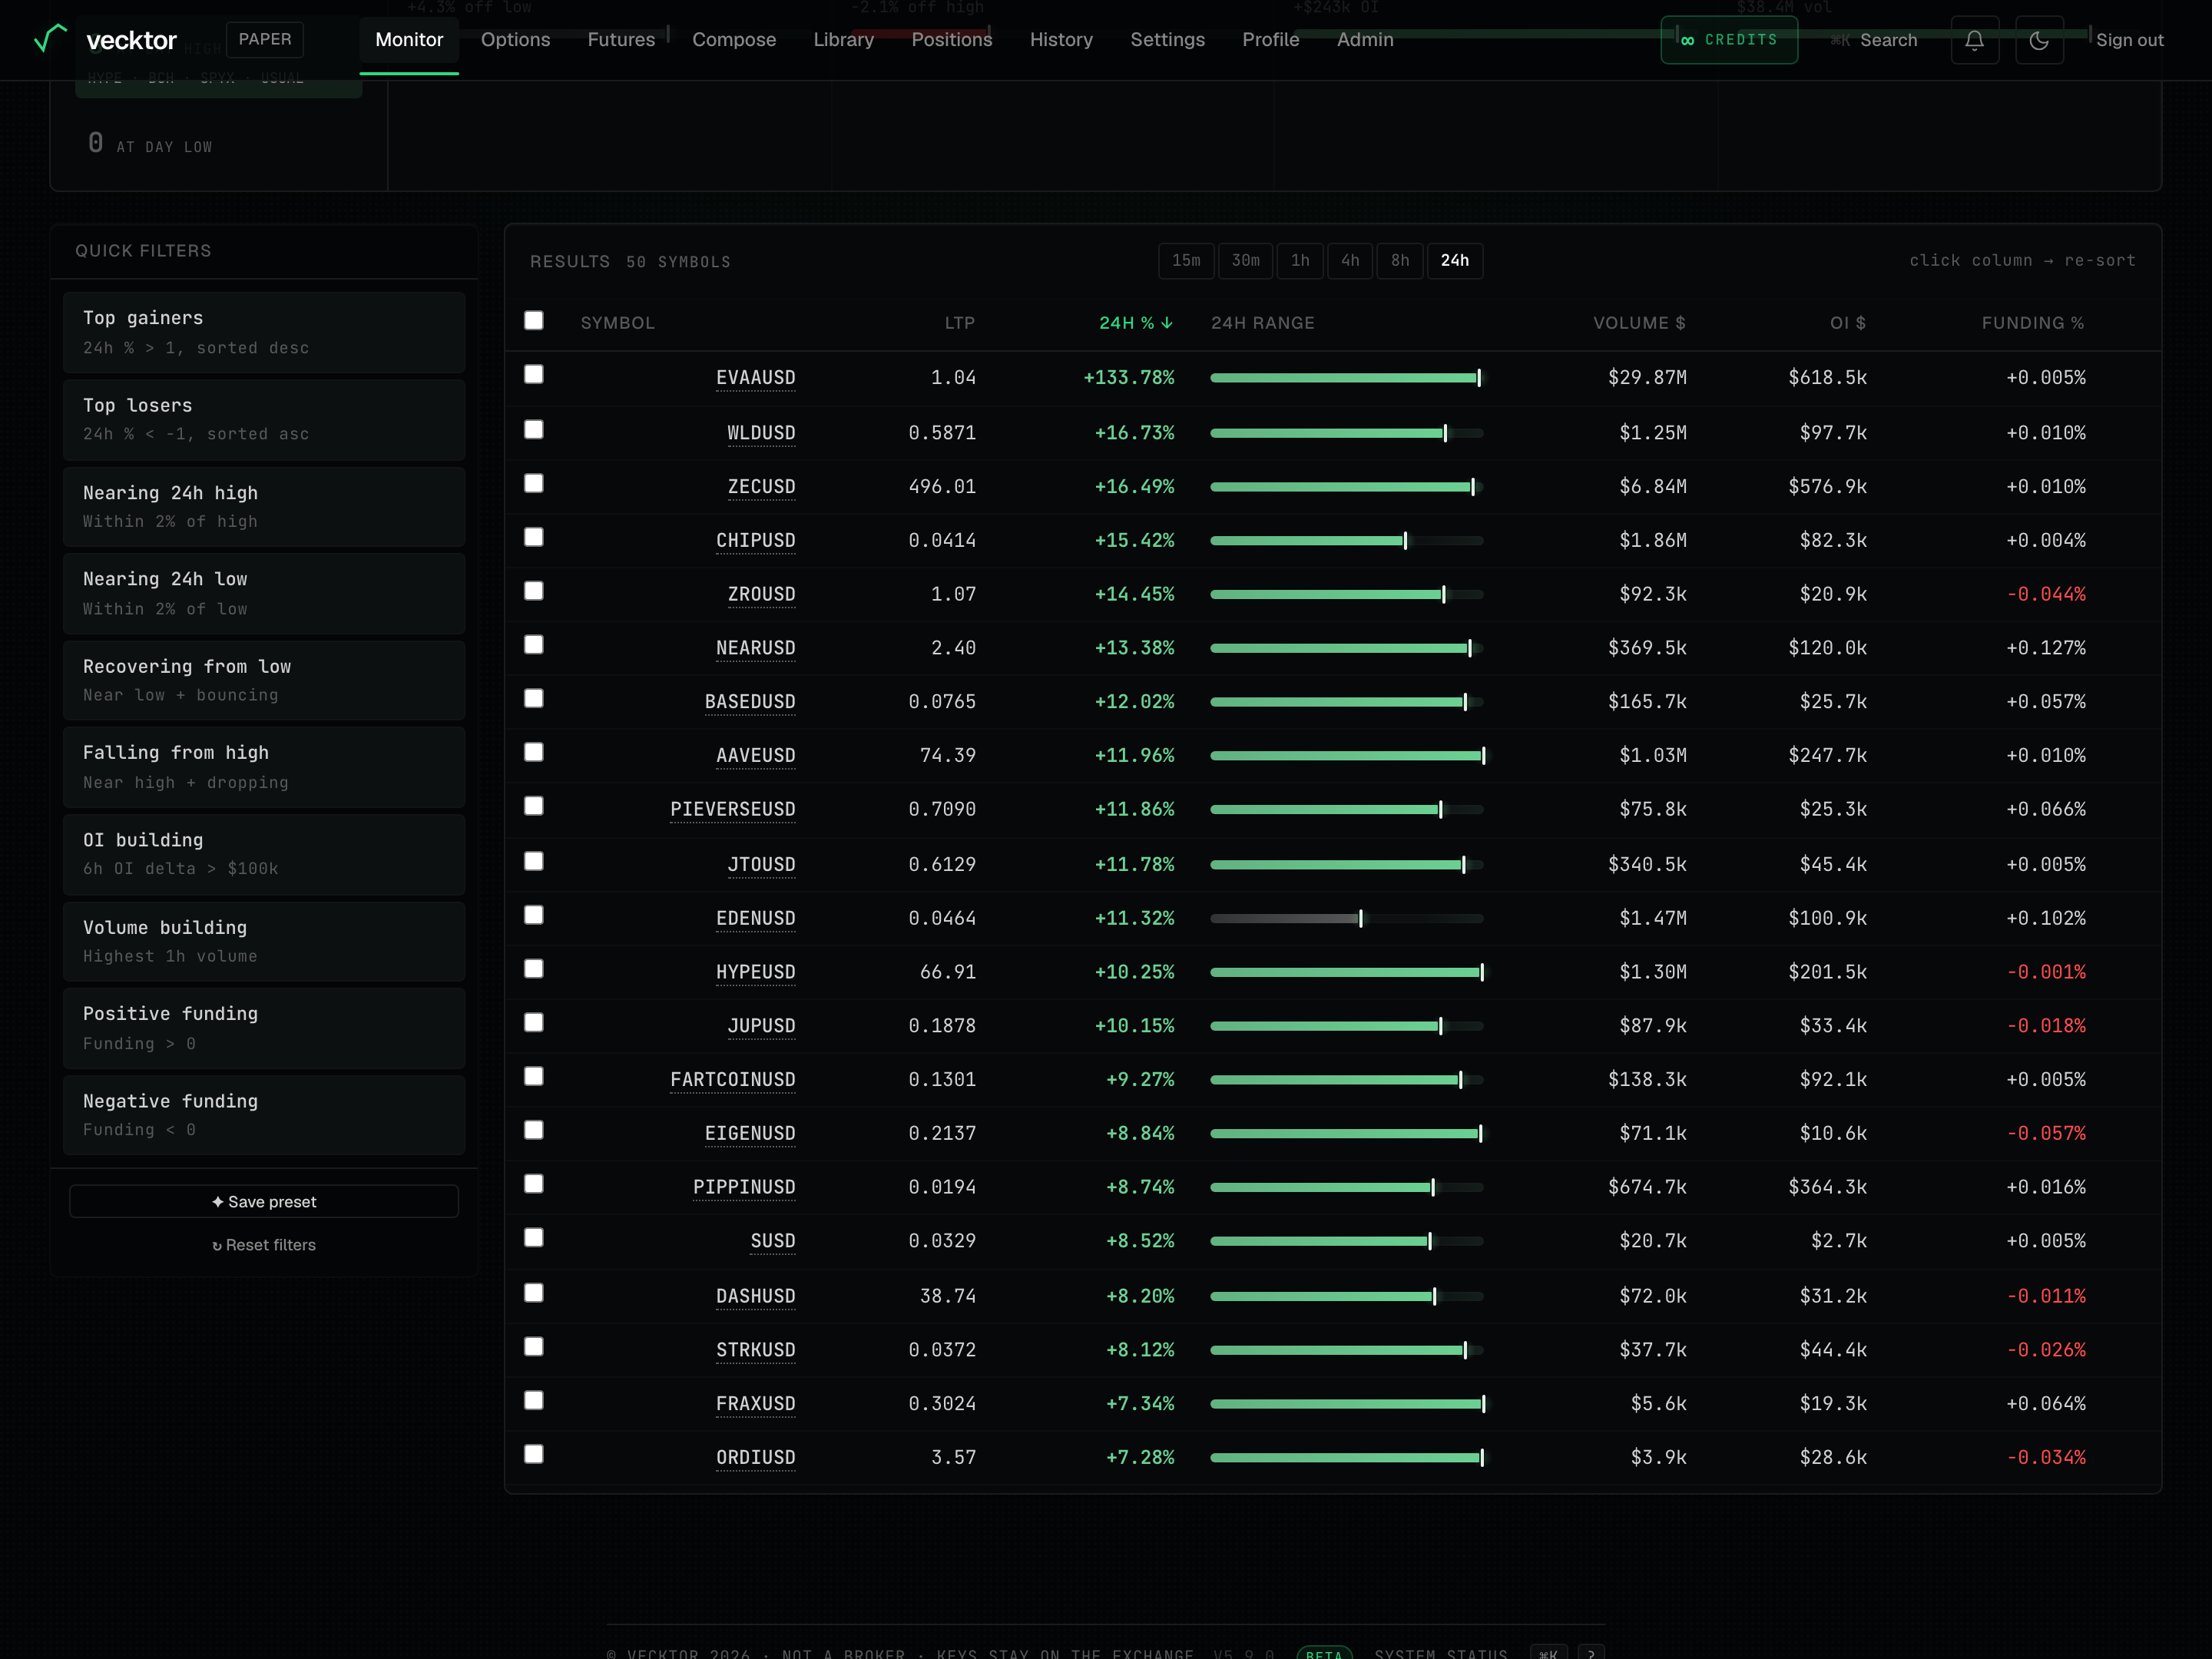
Pick a timeframe and read the results table
The timeframe buttons sit above the table on the right. They recompute the percent, volume, and open-interest columns for the window you choose. Each row is one coin.
- Pick a window: 15m, 30m, 1h, 4h, 8h, or 24h. The 24h window uses Delta's live fields; the shorter windows use our intraday data.
- Read across a row: Symbol, LTP (last traded price), the percent column (headed 24h % or the window you picked, e.g. 1h %), the 24h Range bar, Volume $, OI $ (the dollar total), and Funding %.
- Watch the "↻ updating…" pulse next to the Results label. It blinks on every refresh, including the automatic 10-second refresh, not just the first load.
 2One row per coin
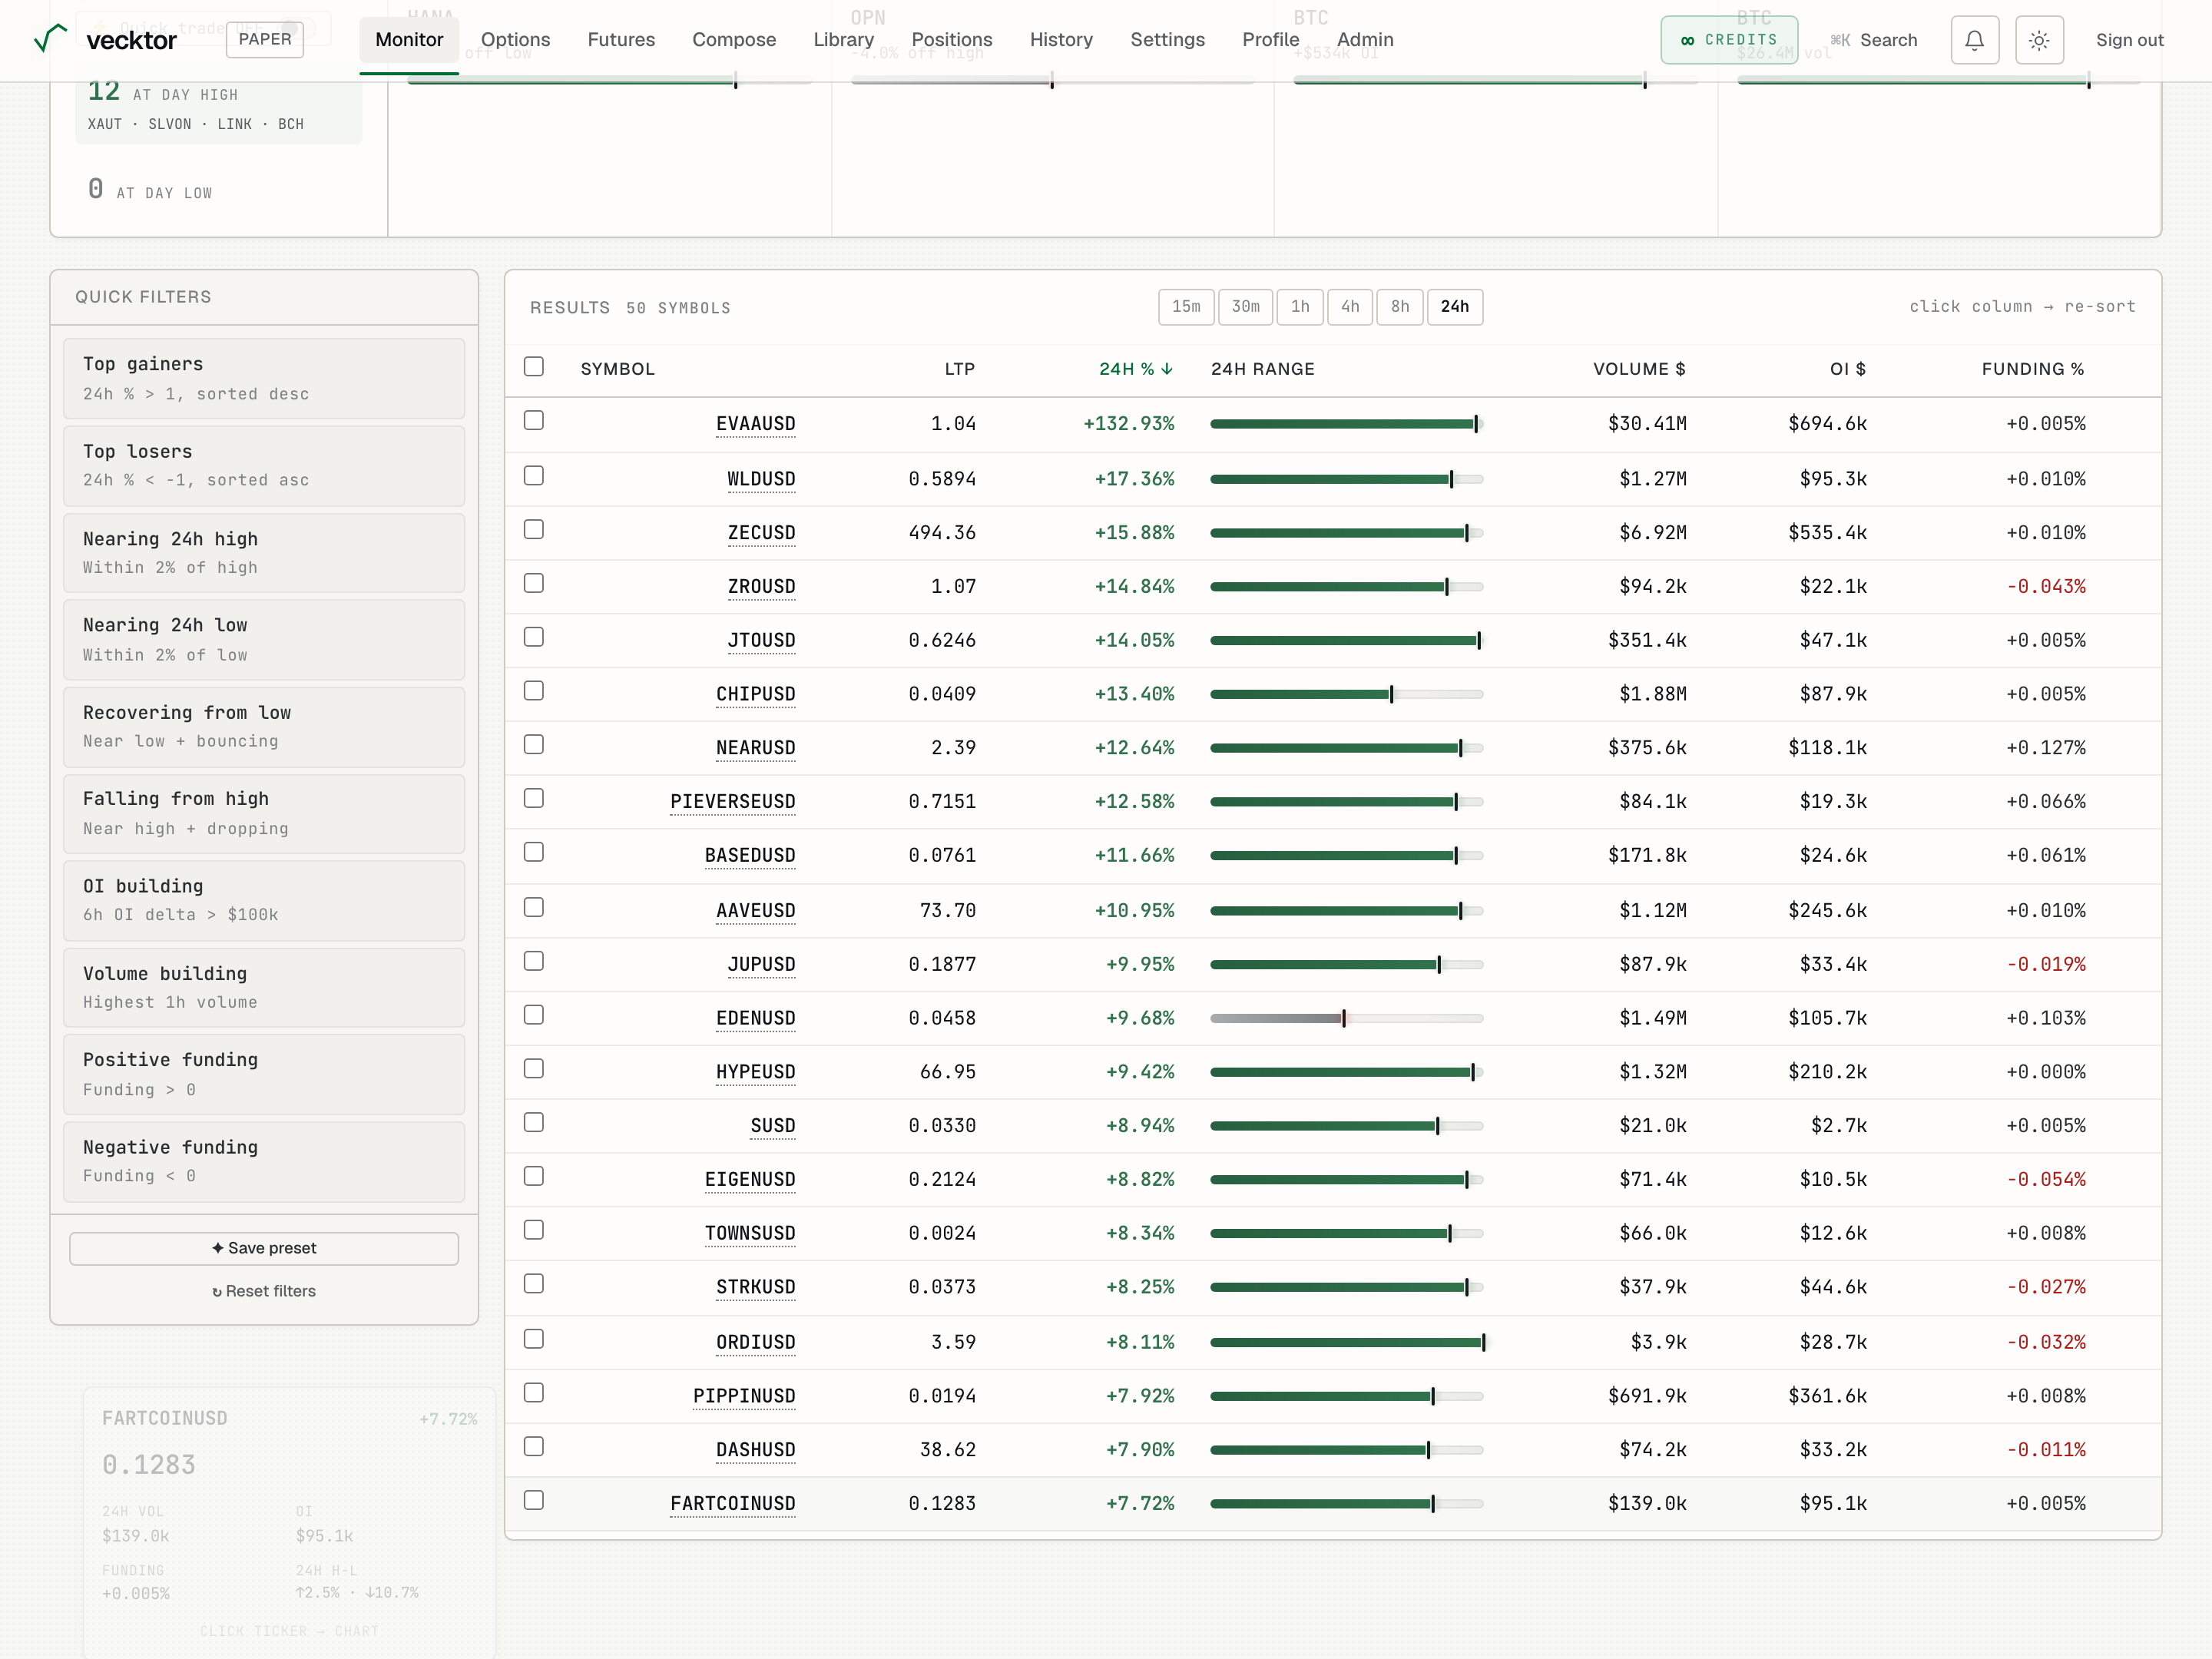
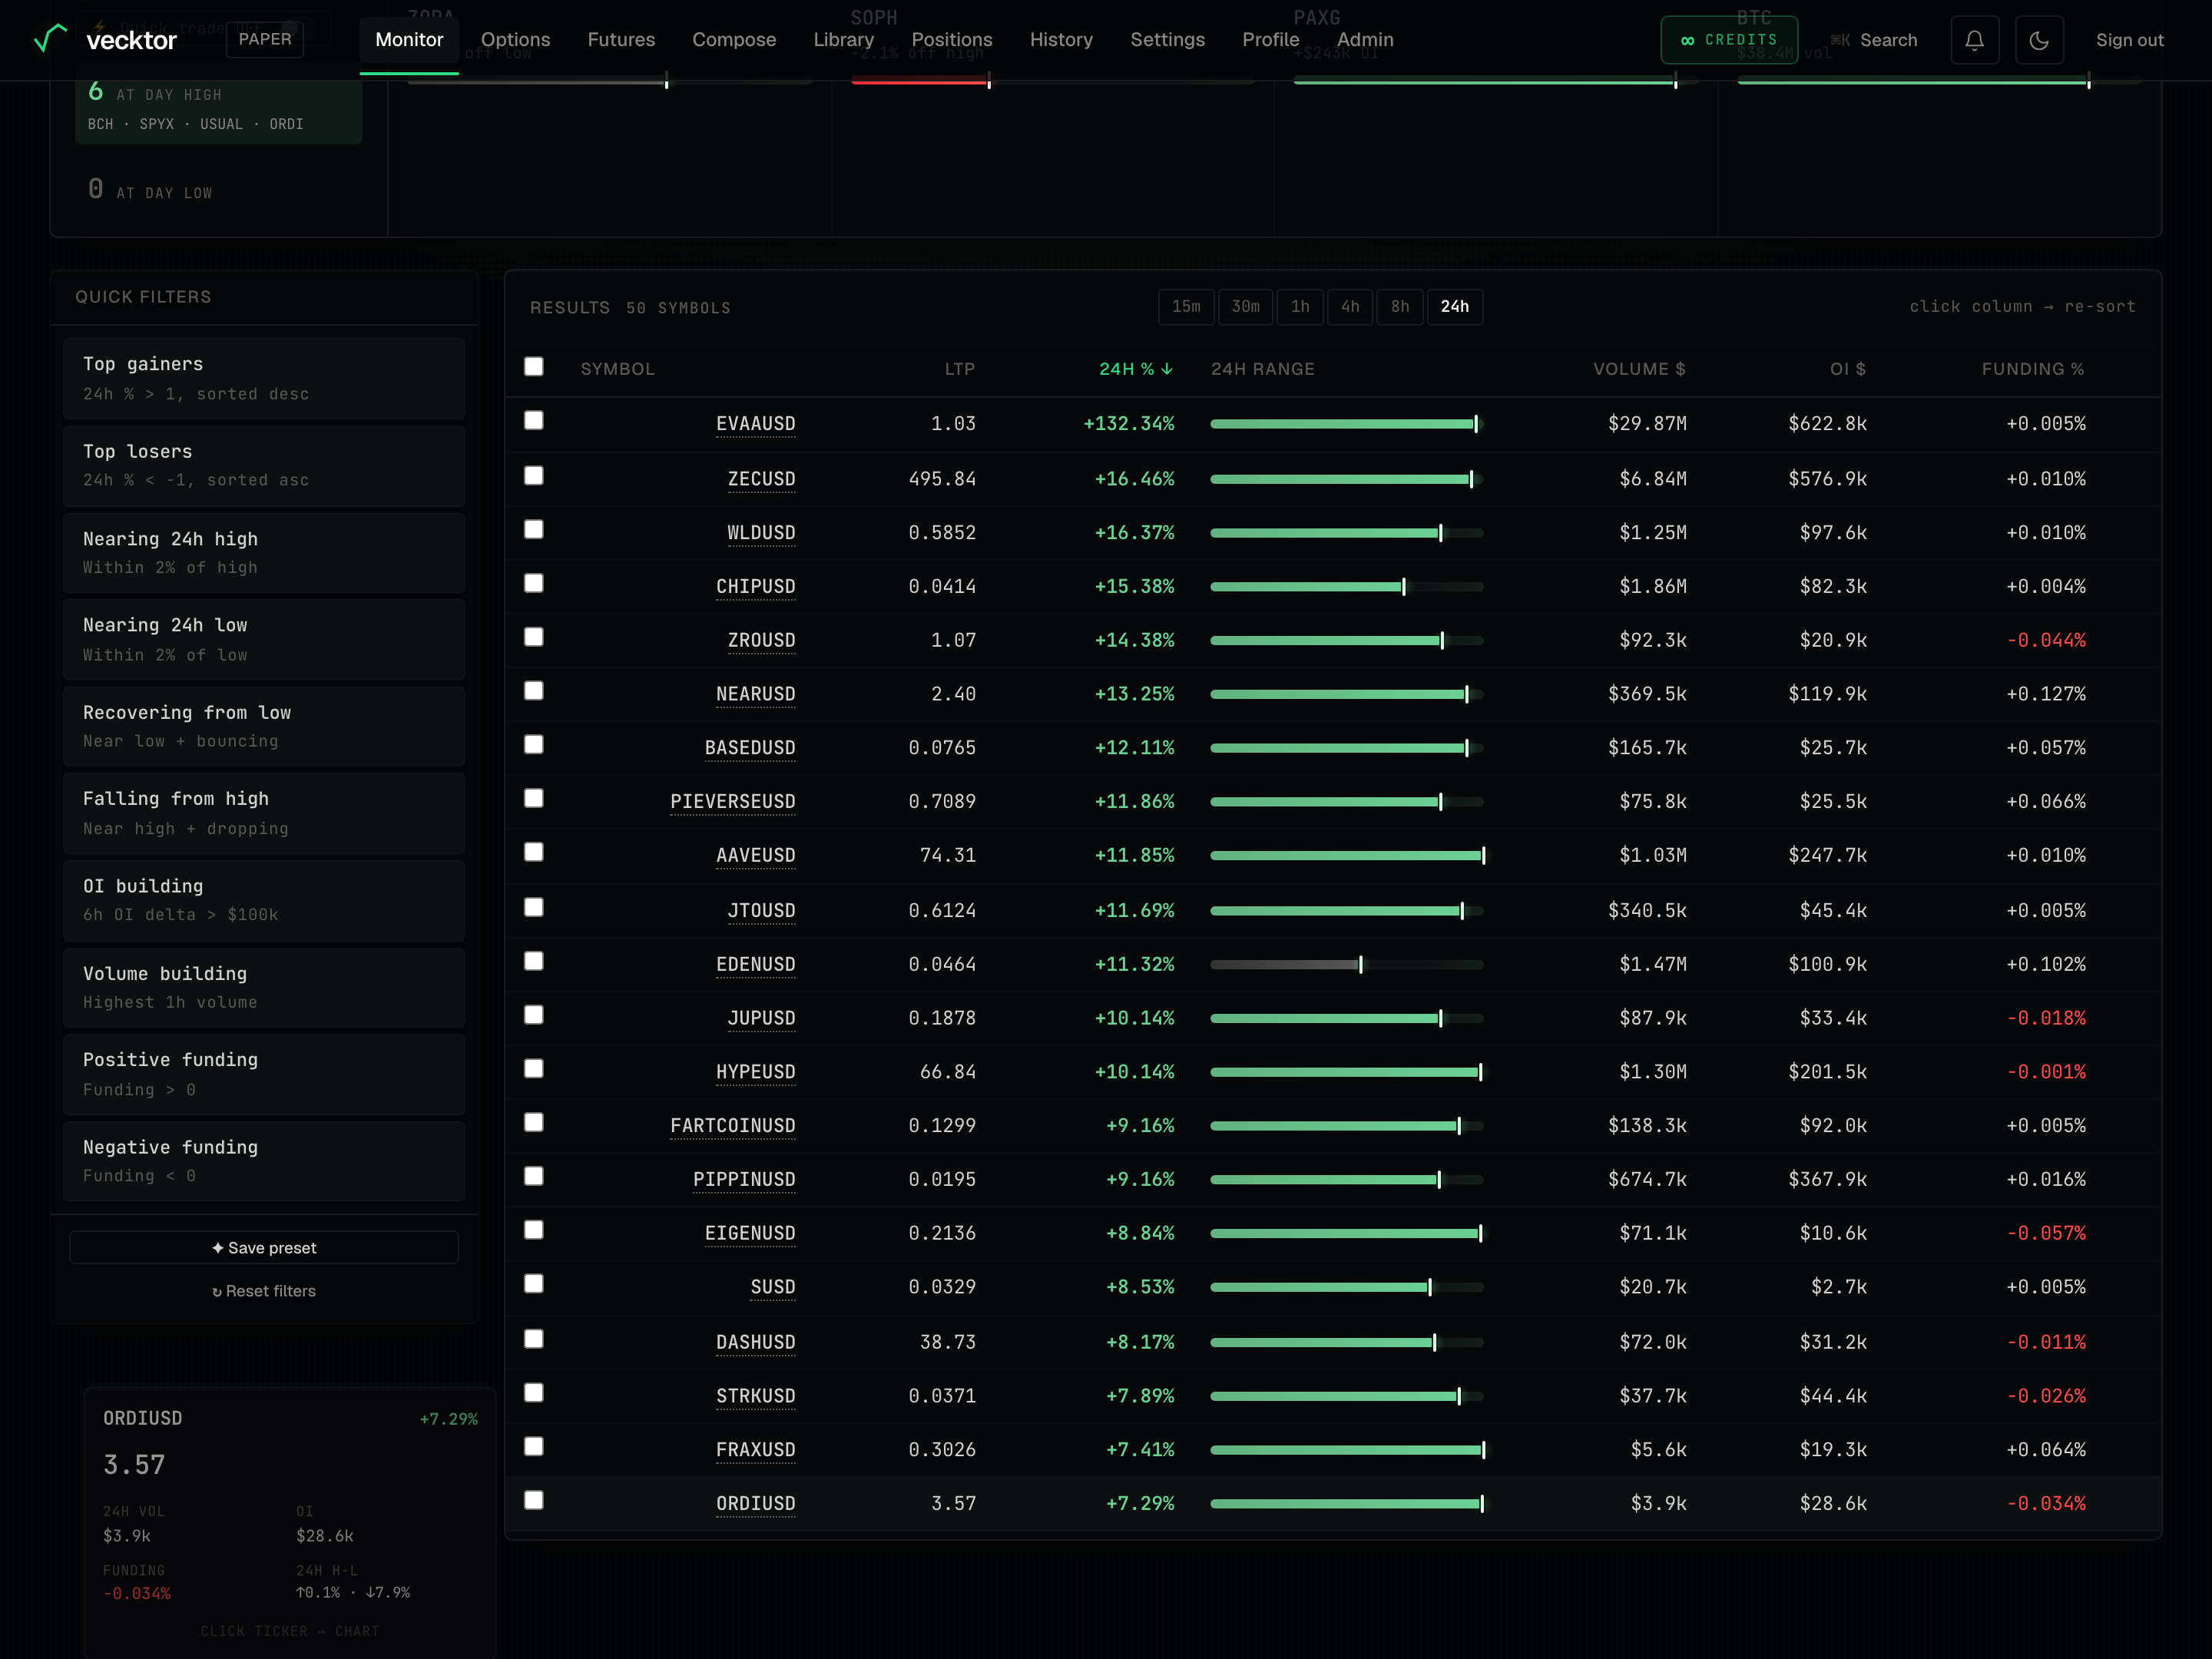
Sort columns and open a chart popup
Most number columns are sortable, and any ticker opens a full chart.
- Click a sortable header: the percent column (24h %), Volume $, OI $, or Funding %.
- Click the same header again to flip between high-to-low and low-to-high. The active header turns the signal color and shows a ↑ or ↓ arrow.
- Click any ticker name (shown with a dotted underline) to open a chart popup for that coin.
- Press Esc, click the × button, or click the dimmed background to close the chart.
 1Click a number header to sort2Sortable columns turn the signal color
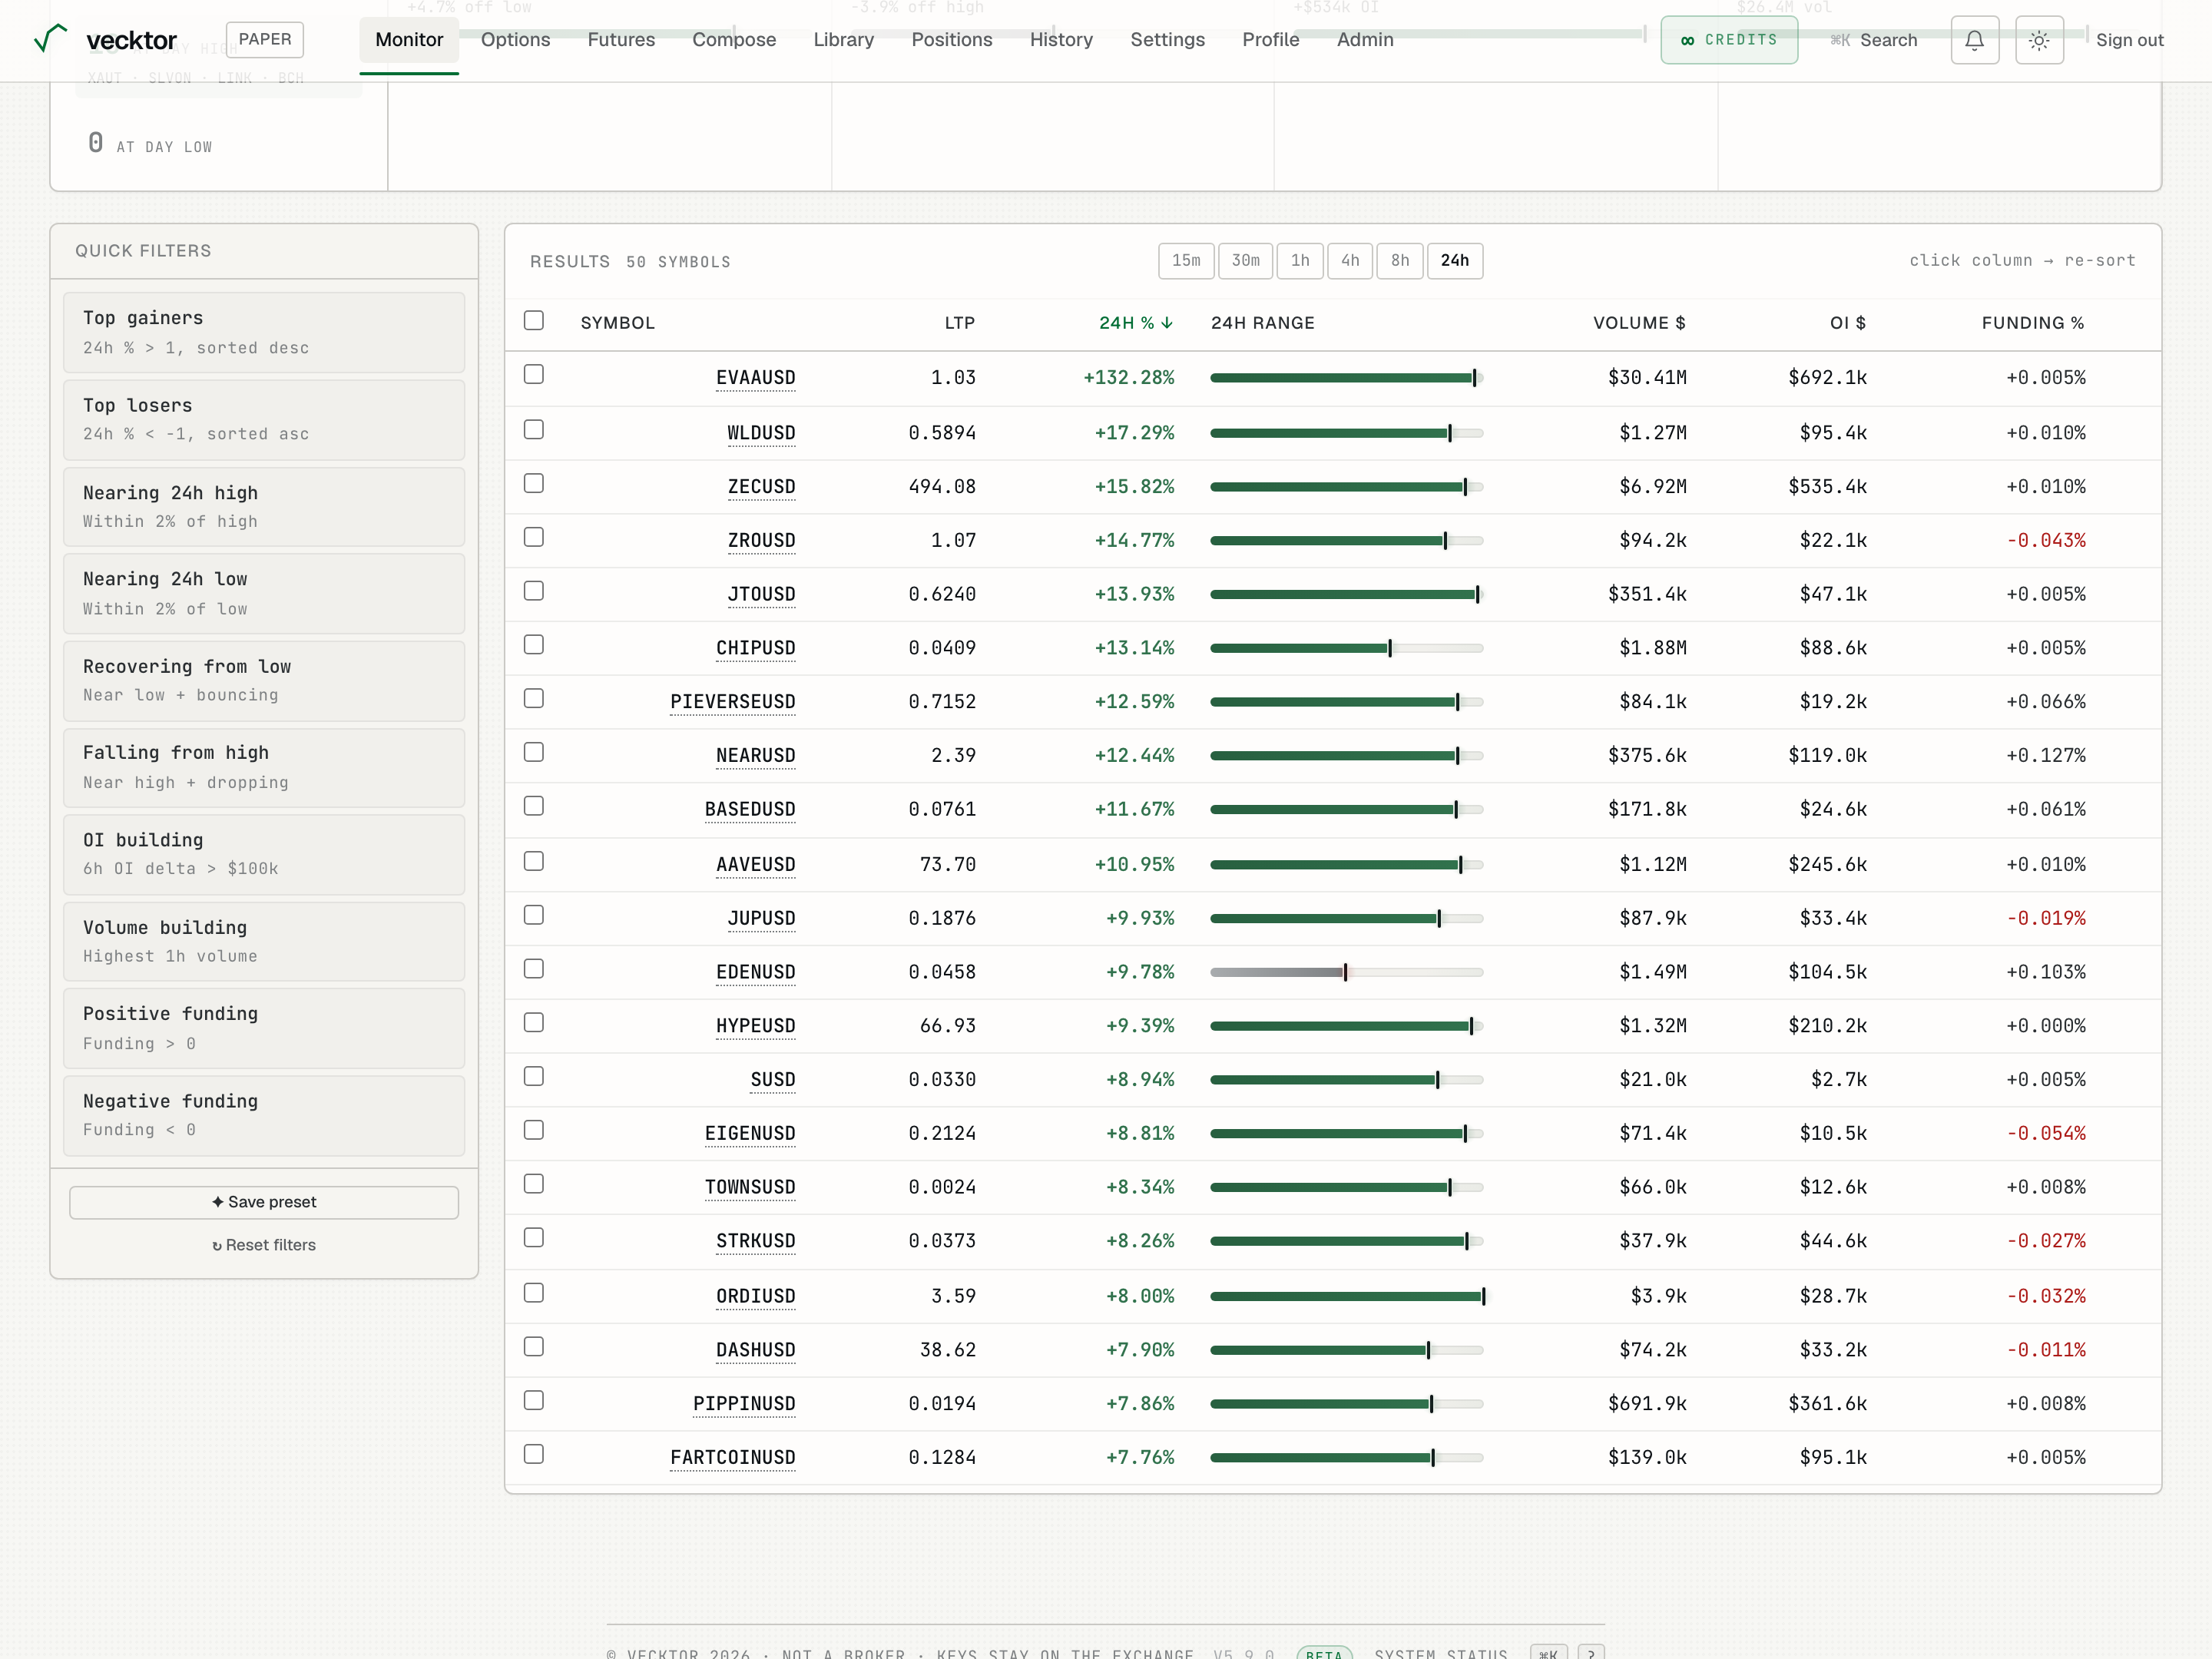
- Click the Funding % header to sort (click again to flip direction)
- Click the dotted ticker (opens a chart popup)
- Read the chart, press Esc to close (drawn from our own Delta data)
Select rows and set bulk price alerts
You can tick several rows and set a price alert on all of them in one go. A price alert just notifies you when the price crosses a level; it does not place a trade.
- Tick the checkbox on each row you want, or tick the header checkbox to select every visible row.
- In the bar that springs up from the bottom (reading "N symbols selected"), click 🎯 Set alerts.
- In the Set N alerts dialog, set the Direction ("Above (mark goes up)" or "Below (mark goes down)") and the Offset % from each coin's current price.
- Click the "Set N alerts →" button to create one alert per selected coin, then watch the toast confirm how many were set.
 1Tick the header to select all visible rows
- Tick the rows you want (or tick the header for all visible)
- Click 🎯 Set alerts in the bottom bar (opens the small dialog)
- Set the Direction and Offset % (Above (mark goes up) or Below (mark goes down))
- Mind the 50/user cap (shared with single-row alerts)
Quick trade a single row
With ⚡ Quick trade ON, every row gets a Trade → button that opens a small order ticket (headed "COIN · market"). The order is placed only when you click Buy or Sell, never on a stray row click.
- Click Trade → on the row you want.
- Set the Lots (size) and the SL % (stop loss, the percent move from entry that closes the trade to cap a loss).
- Click Buy or Sell. The footer note reads "Market order on your connected Delta account." and the stop is attached.
- Read the "Order placed" confirmation in the ticket, then click "View positions →" to follow it.
Keyboard shortcuts, hover preview and the row menu
The scanner is built for fast hands. There are keyboard shortcuts, a hover preview, and a right-click menu.
- Press j or the down arrow to move the cursor to the next row, and k or the up arrow to move back up.
- Press x to tick or untick the row under the cursor, and Enter to open a trade for it.
- Press the / key to jump straight to the ✦ AI mode box.
- Hover a row for a moment to see a mini preview card (price, 24h vol, OI, Funding, and the 24h H-L distance).
- Right-click a row, or long-press it on a phone, for a menu with "Trade →", "Copy symbol", and "Add to selection" (or "Deselect row" if it is already selected).
- Press j or k to move the cursor (next or previous row)
- Press x to select the cursor row
- Press Enter to trade it (opens the order ticket)
- Hover for the preview, right-click for the menu (long-press on a phone)
Quick trade is always live
Every Trade button here places a real order on your funded Delta account. There is no practice mode.
- Set your size and a stop loss before you quick trade.
- Confirm the one-time live risk acknowledgement the first time you trade.
Scan on a phone
On a small screen the results show as a card list instead of the wide table, so nothing scrolls off-screen.
- Read each coin as a card: ticker and price on top, the percent and range bar, then a small grid of Vol, OI (or OI Δ on a shorter timeframe), and Funding.
- Tap the ticker to open its chart.
- Tap the checkbox to add a card to your selection for bulk alerts.
- Tap Trade → on a card to open the order ticket, the same as on desktop.