Backtest a futures strategy
The futures page is where you pick a ready-made strategy or build your own, test it against real Delta India perpetual prices, and read a full results breakdown. This guide walks the three-step flow (Choose, Tune, Results), every config control, how to read the numbers, and what you can do with a result once you trust it.
Sign in first
Backtesting is behind a sign-in. Anyone who is not signed in is sent to the login page and brought straight back here afterwards.
- Open /futures. If you are not signed in you will see "Sign in to backtest".
- Click Sign in. After login you land back on this page.
- Once signed in, the three-step flow appears.
Follow the three steps
A strip at the top shows Choose, Tune and Results. It is your map through the flow. Each step unlocks the next.
- Choose: pick a strategy (ready-made or your own).
- Tune: set coins, dates and risk.
- Results: read the metrics and analysis after a run.
- Click a numbered step to jump back once you have reached it. While a backtest runs, the active step shows a spinner.
- Open the ↺ History button on the strip. The Recent runs popover reloads any of your last ten runs.
 1Step 1: pick a strategy2Step 2: coins, dates, risk3Reload a recent run
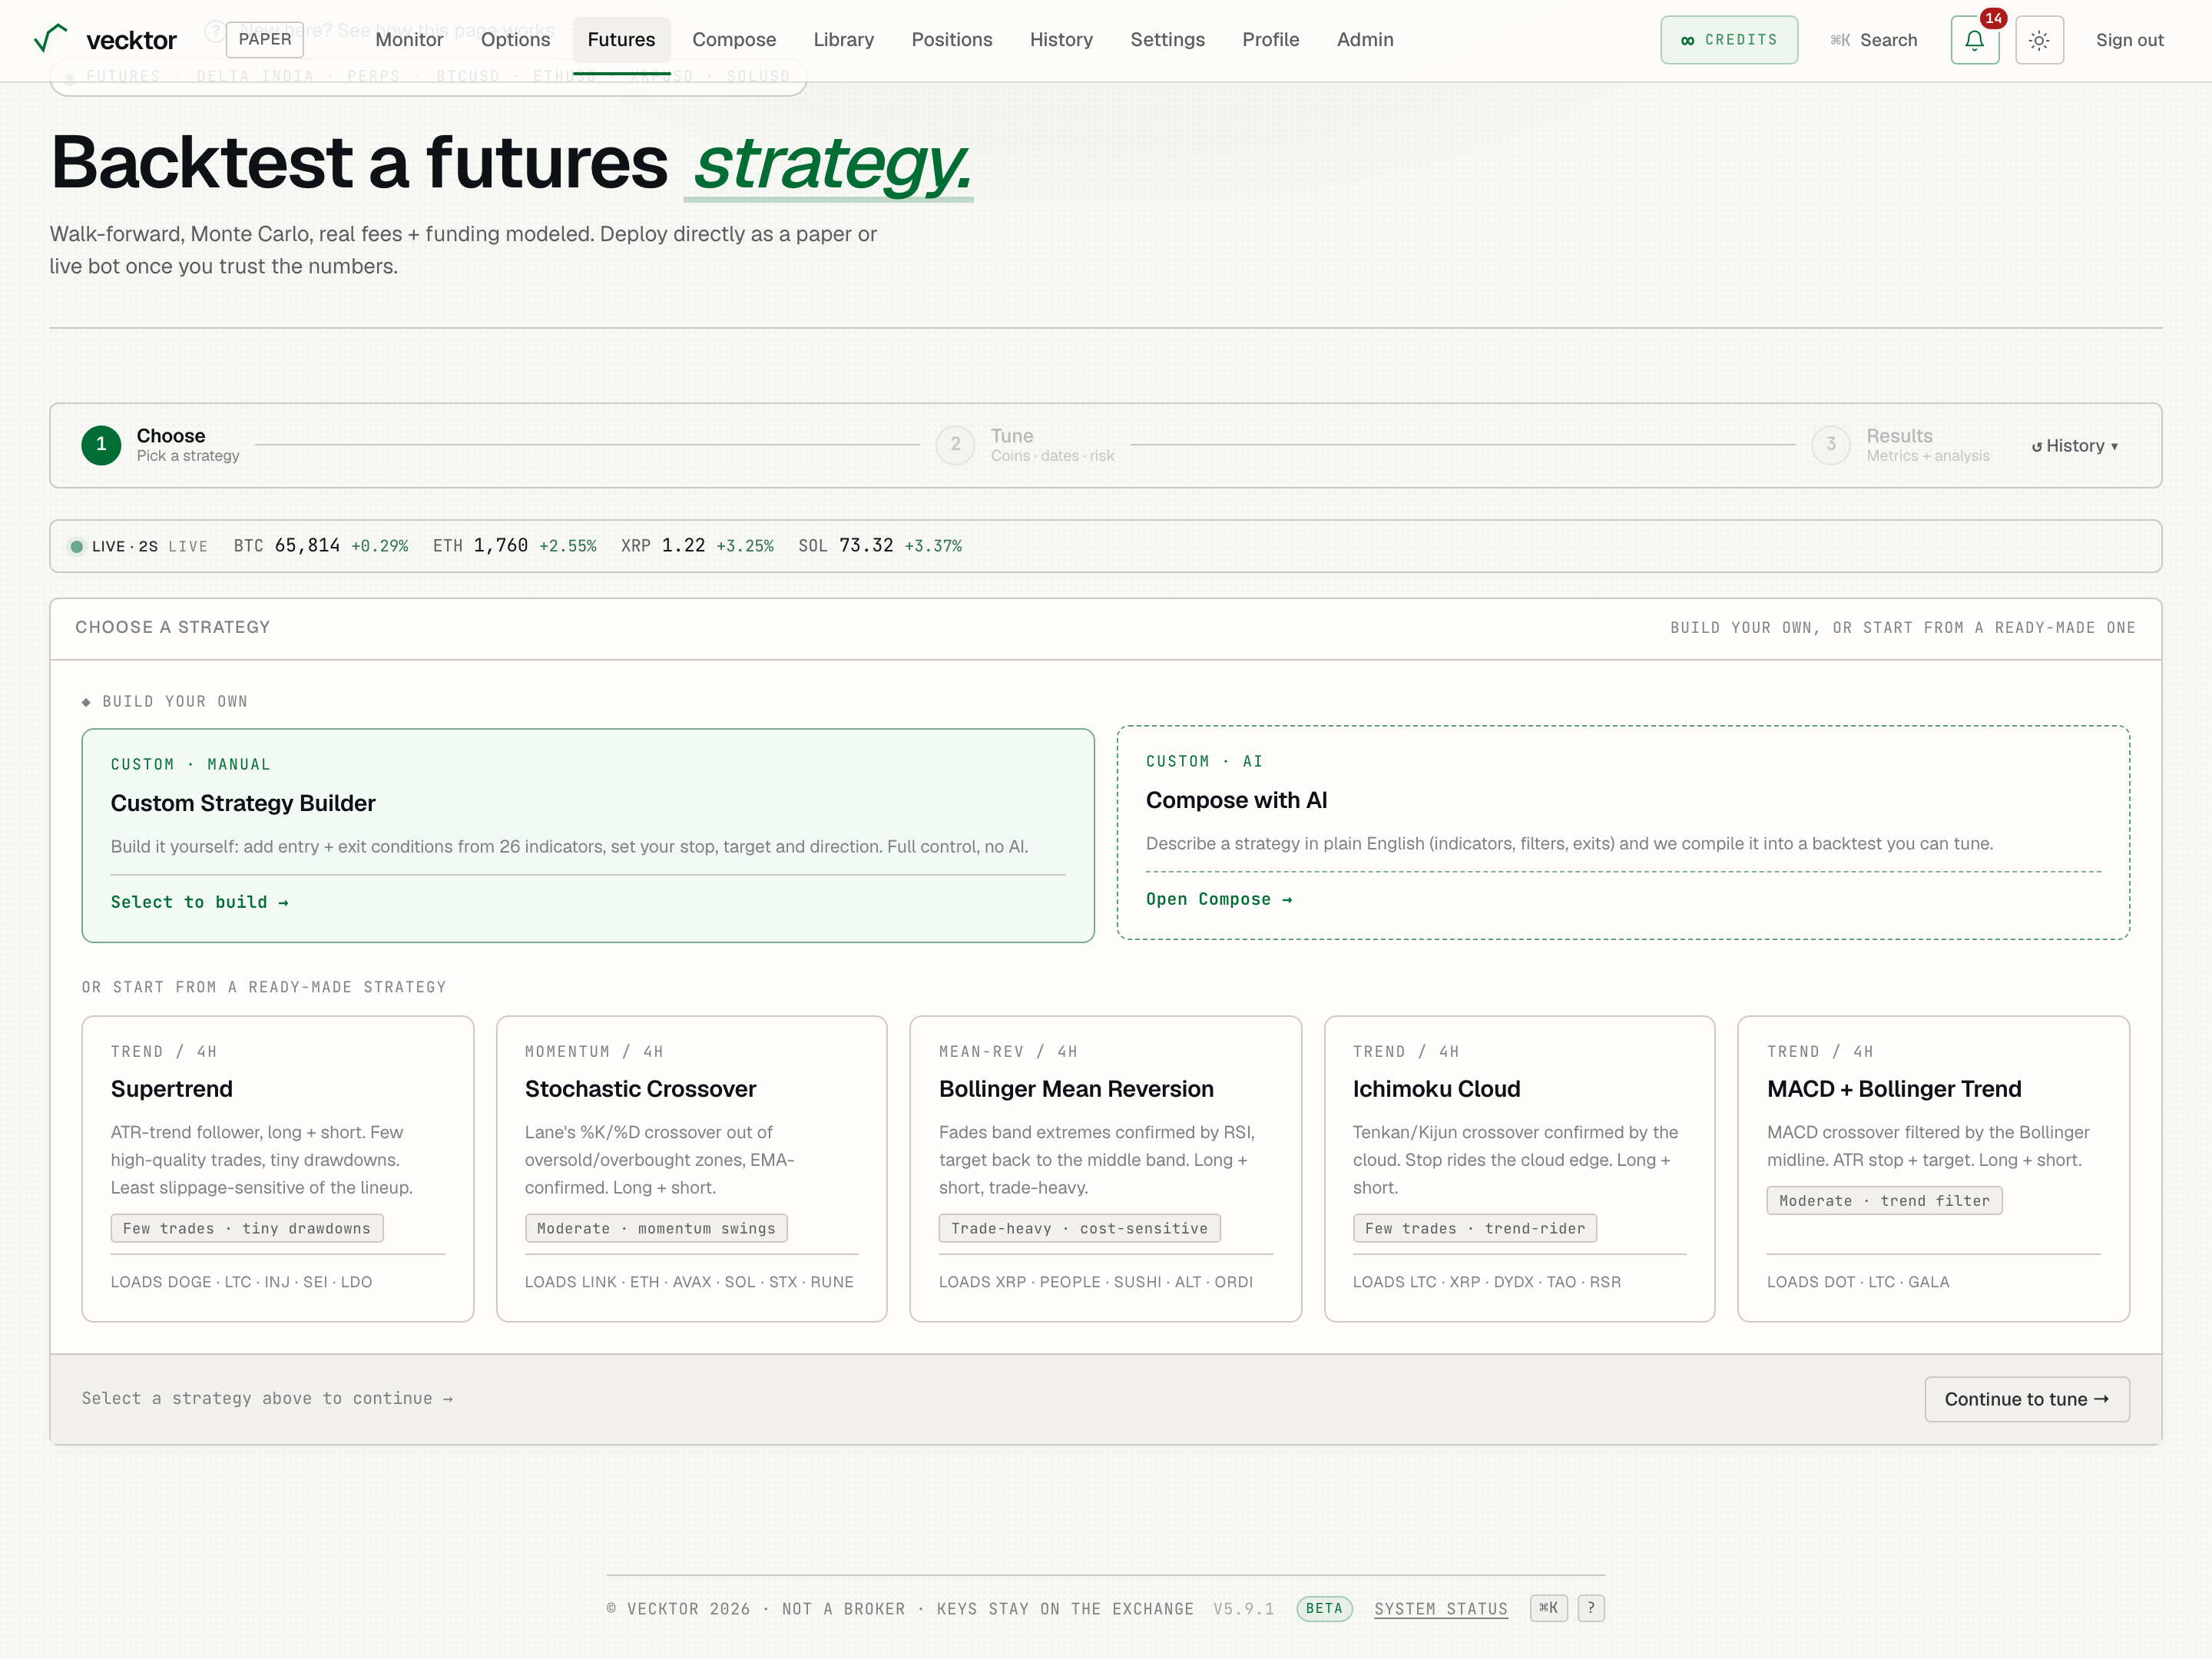
- Start in Choose (Pick a strategy)
- Tune unlocks next (Coins · dates · risk)
- Results opens after a run (Metrics + analysis)
- Open ↺ History (the Recent runs popover reloads your last ten runs)
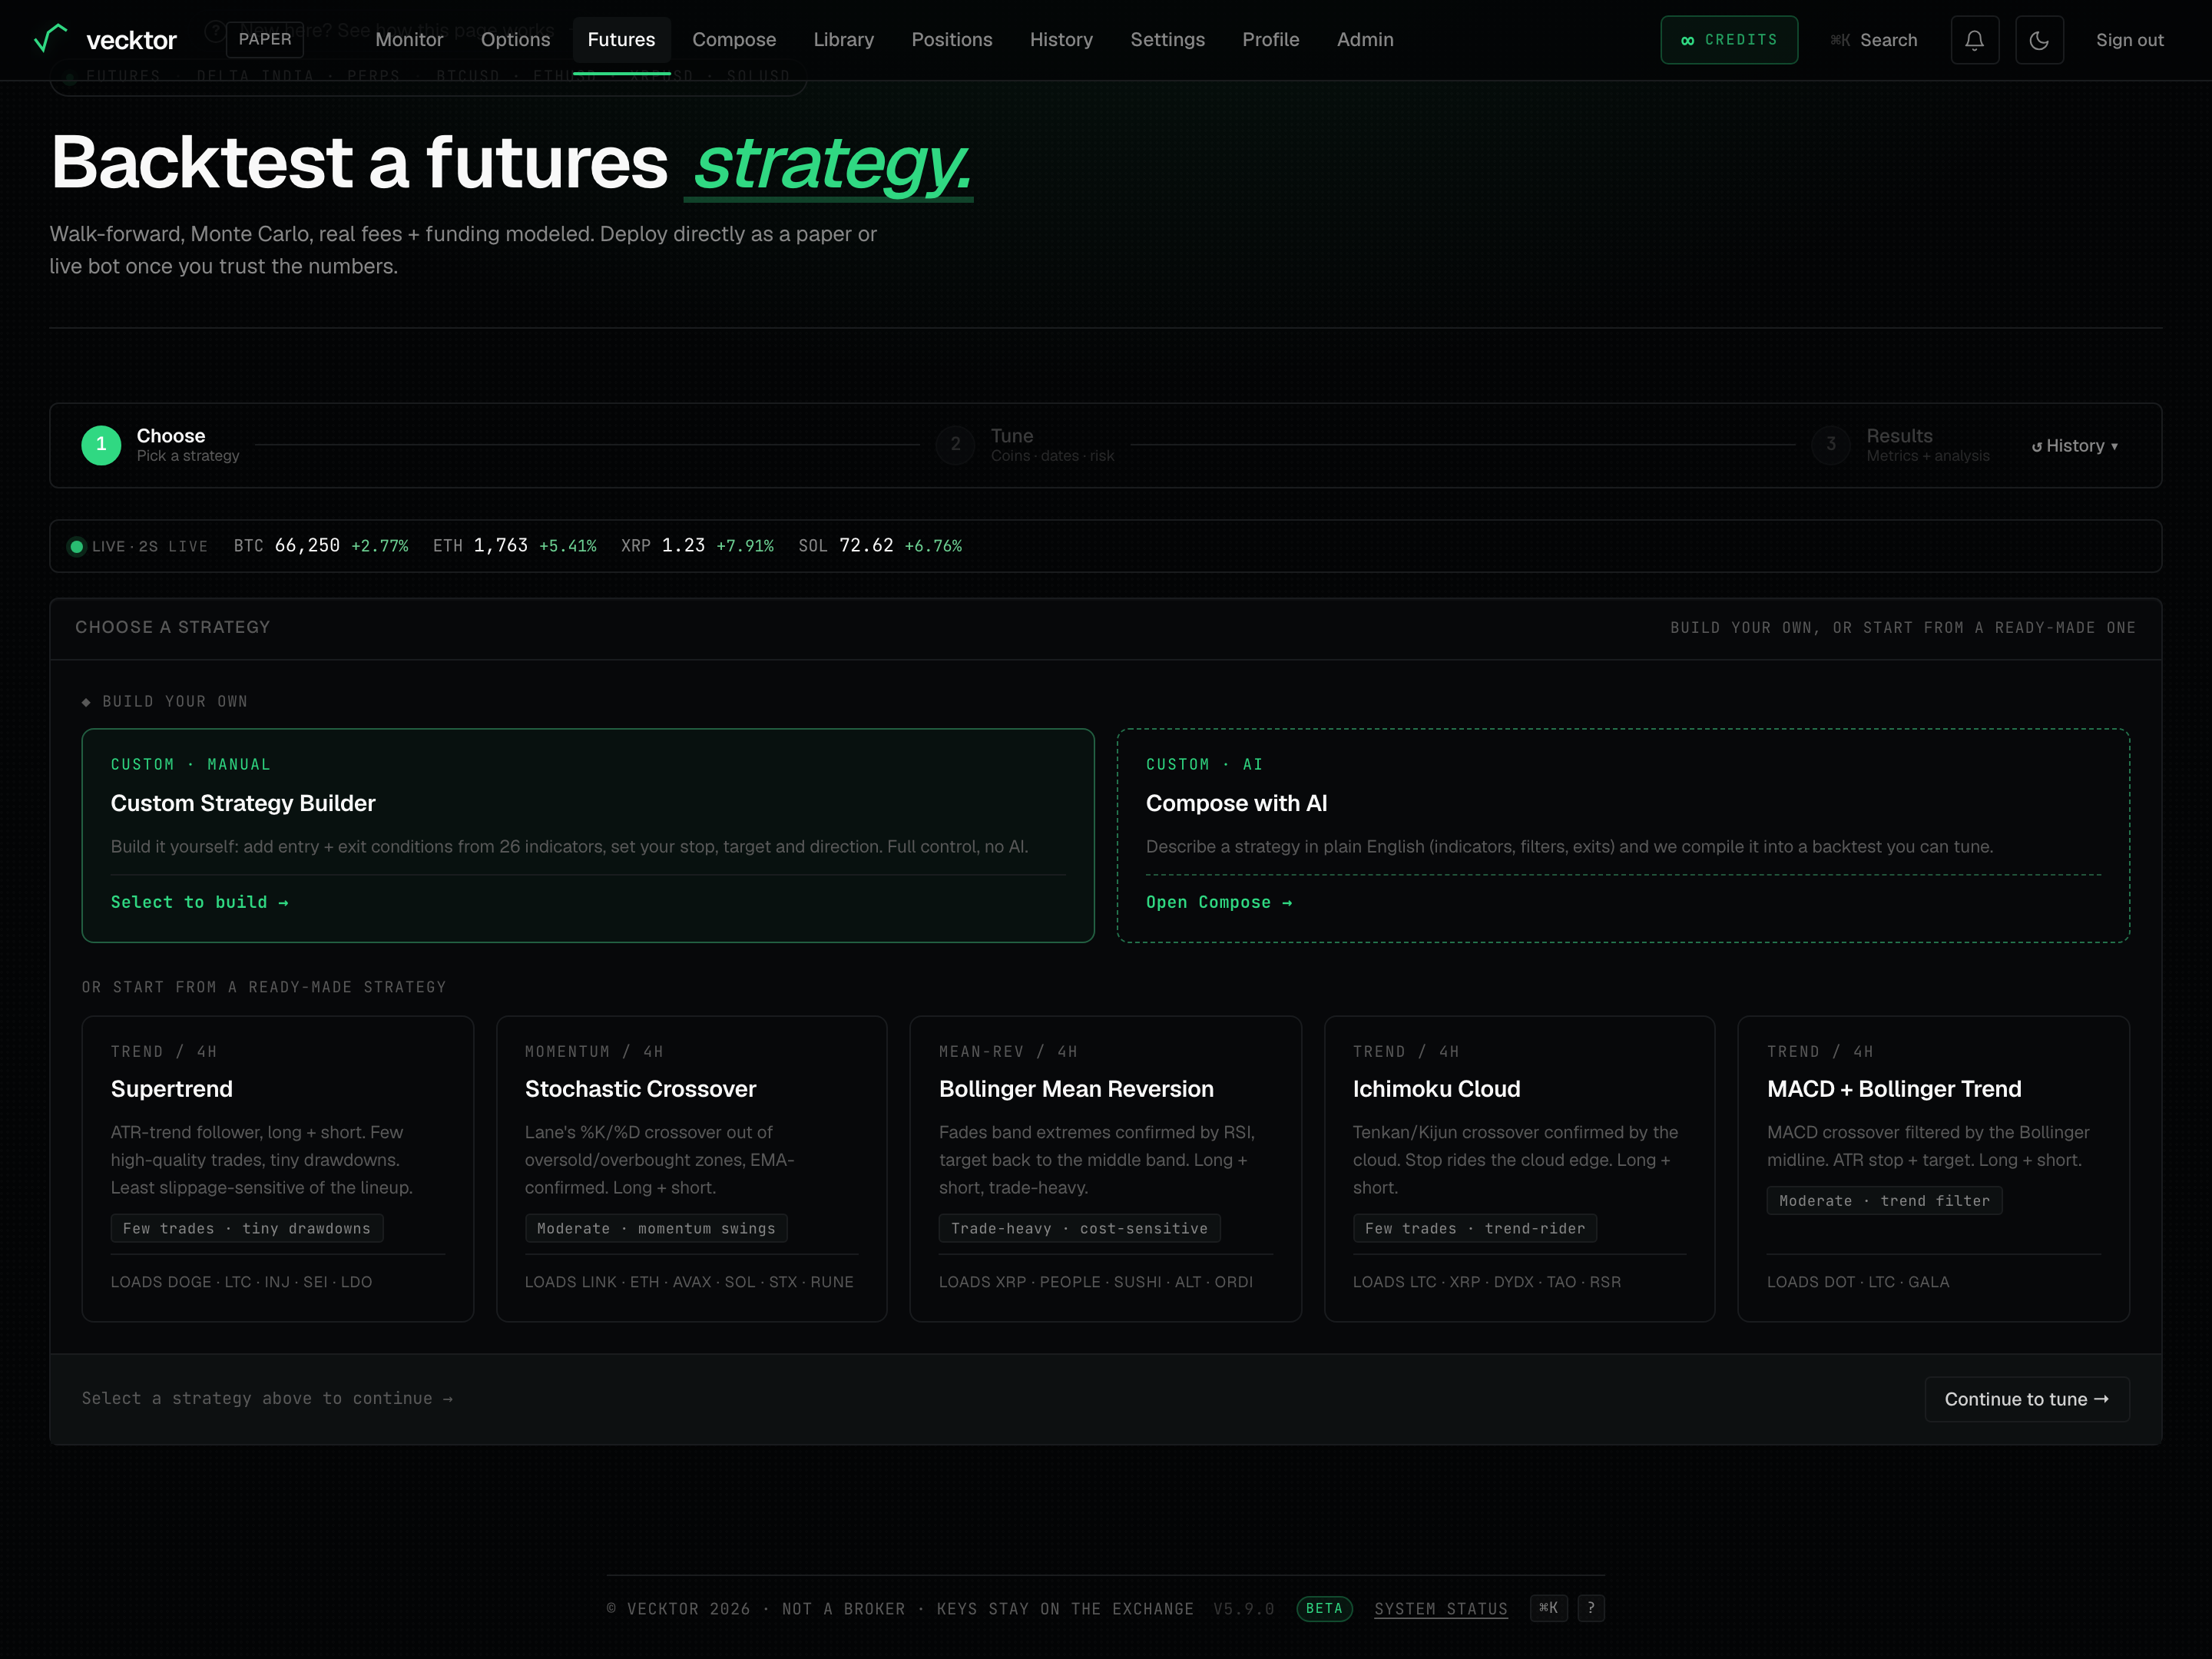
Choose a strategy
The Choose step leads with "◆ Build your own", then lists the ready-made strategies below under "Or start from a ready-made strategy".
- Under "◆ Build your own", pick Custom Strategy Builder to build the rules yourself with no AI.
- Or pick Compose with AI to describe a strategy in plain English on the Compose page. Compose runs on credits.
- Or pick one of the ready-made strategy cards lower down (Supertrend, Stochastic Crossover, Bollinger Mean Reversion, Ichimoku Cloud, MACD + Bollinger Trend). Selecting one loads its suggested coins and its designed timeframe.
- Read the selection line at the bottom, then click "Continue to tune" (it reads "Continue to build" for the custom builder) to advance to Tune.
 1Build the rules yourself2Ready-made strategy cards3Advance to Tune
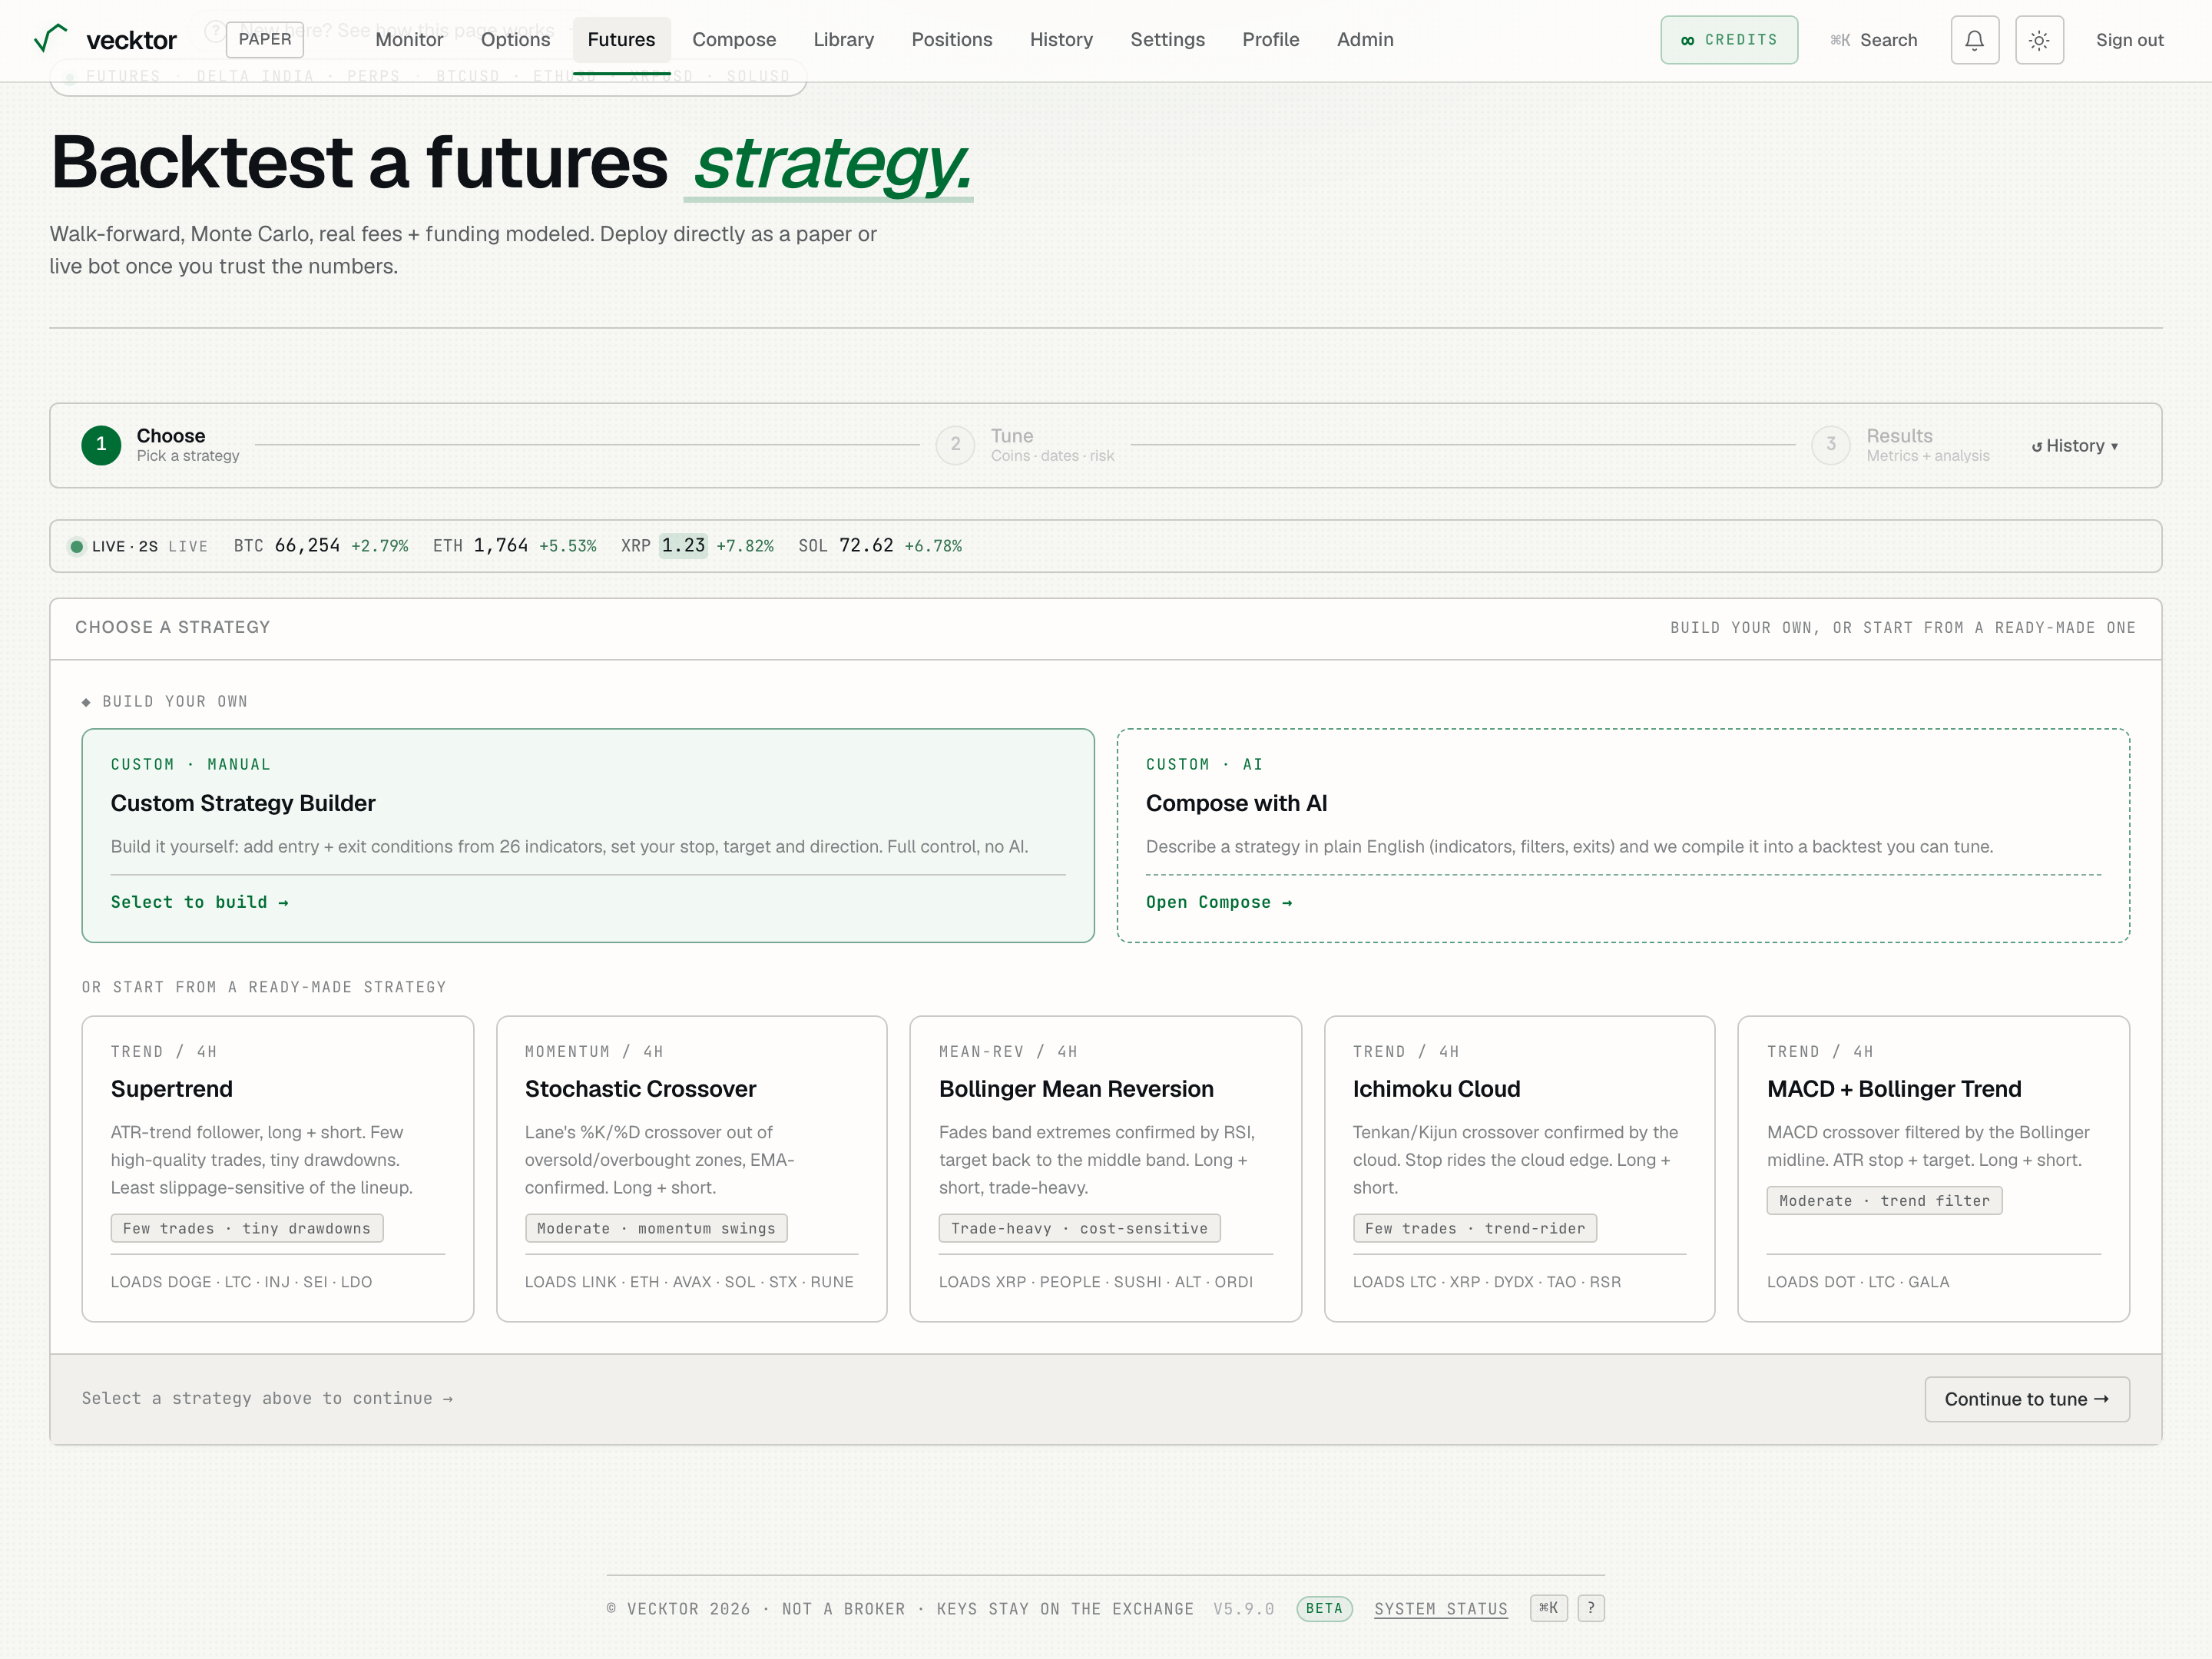
- Pick Custom Strategy Builder to build by hand (no AI, no credits)
- Pick Compose with AI to describe one (plain English, runs on credits)
- Or pick a ready-made card (loads its coins and timeframe)
- Click Continue to tune (advances to Tune)
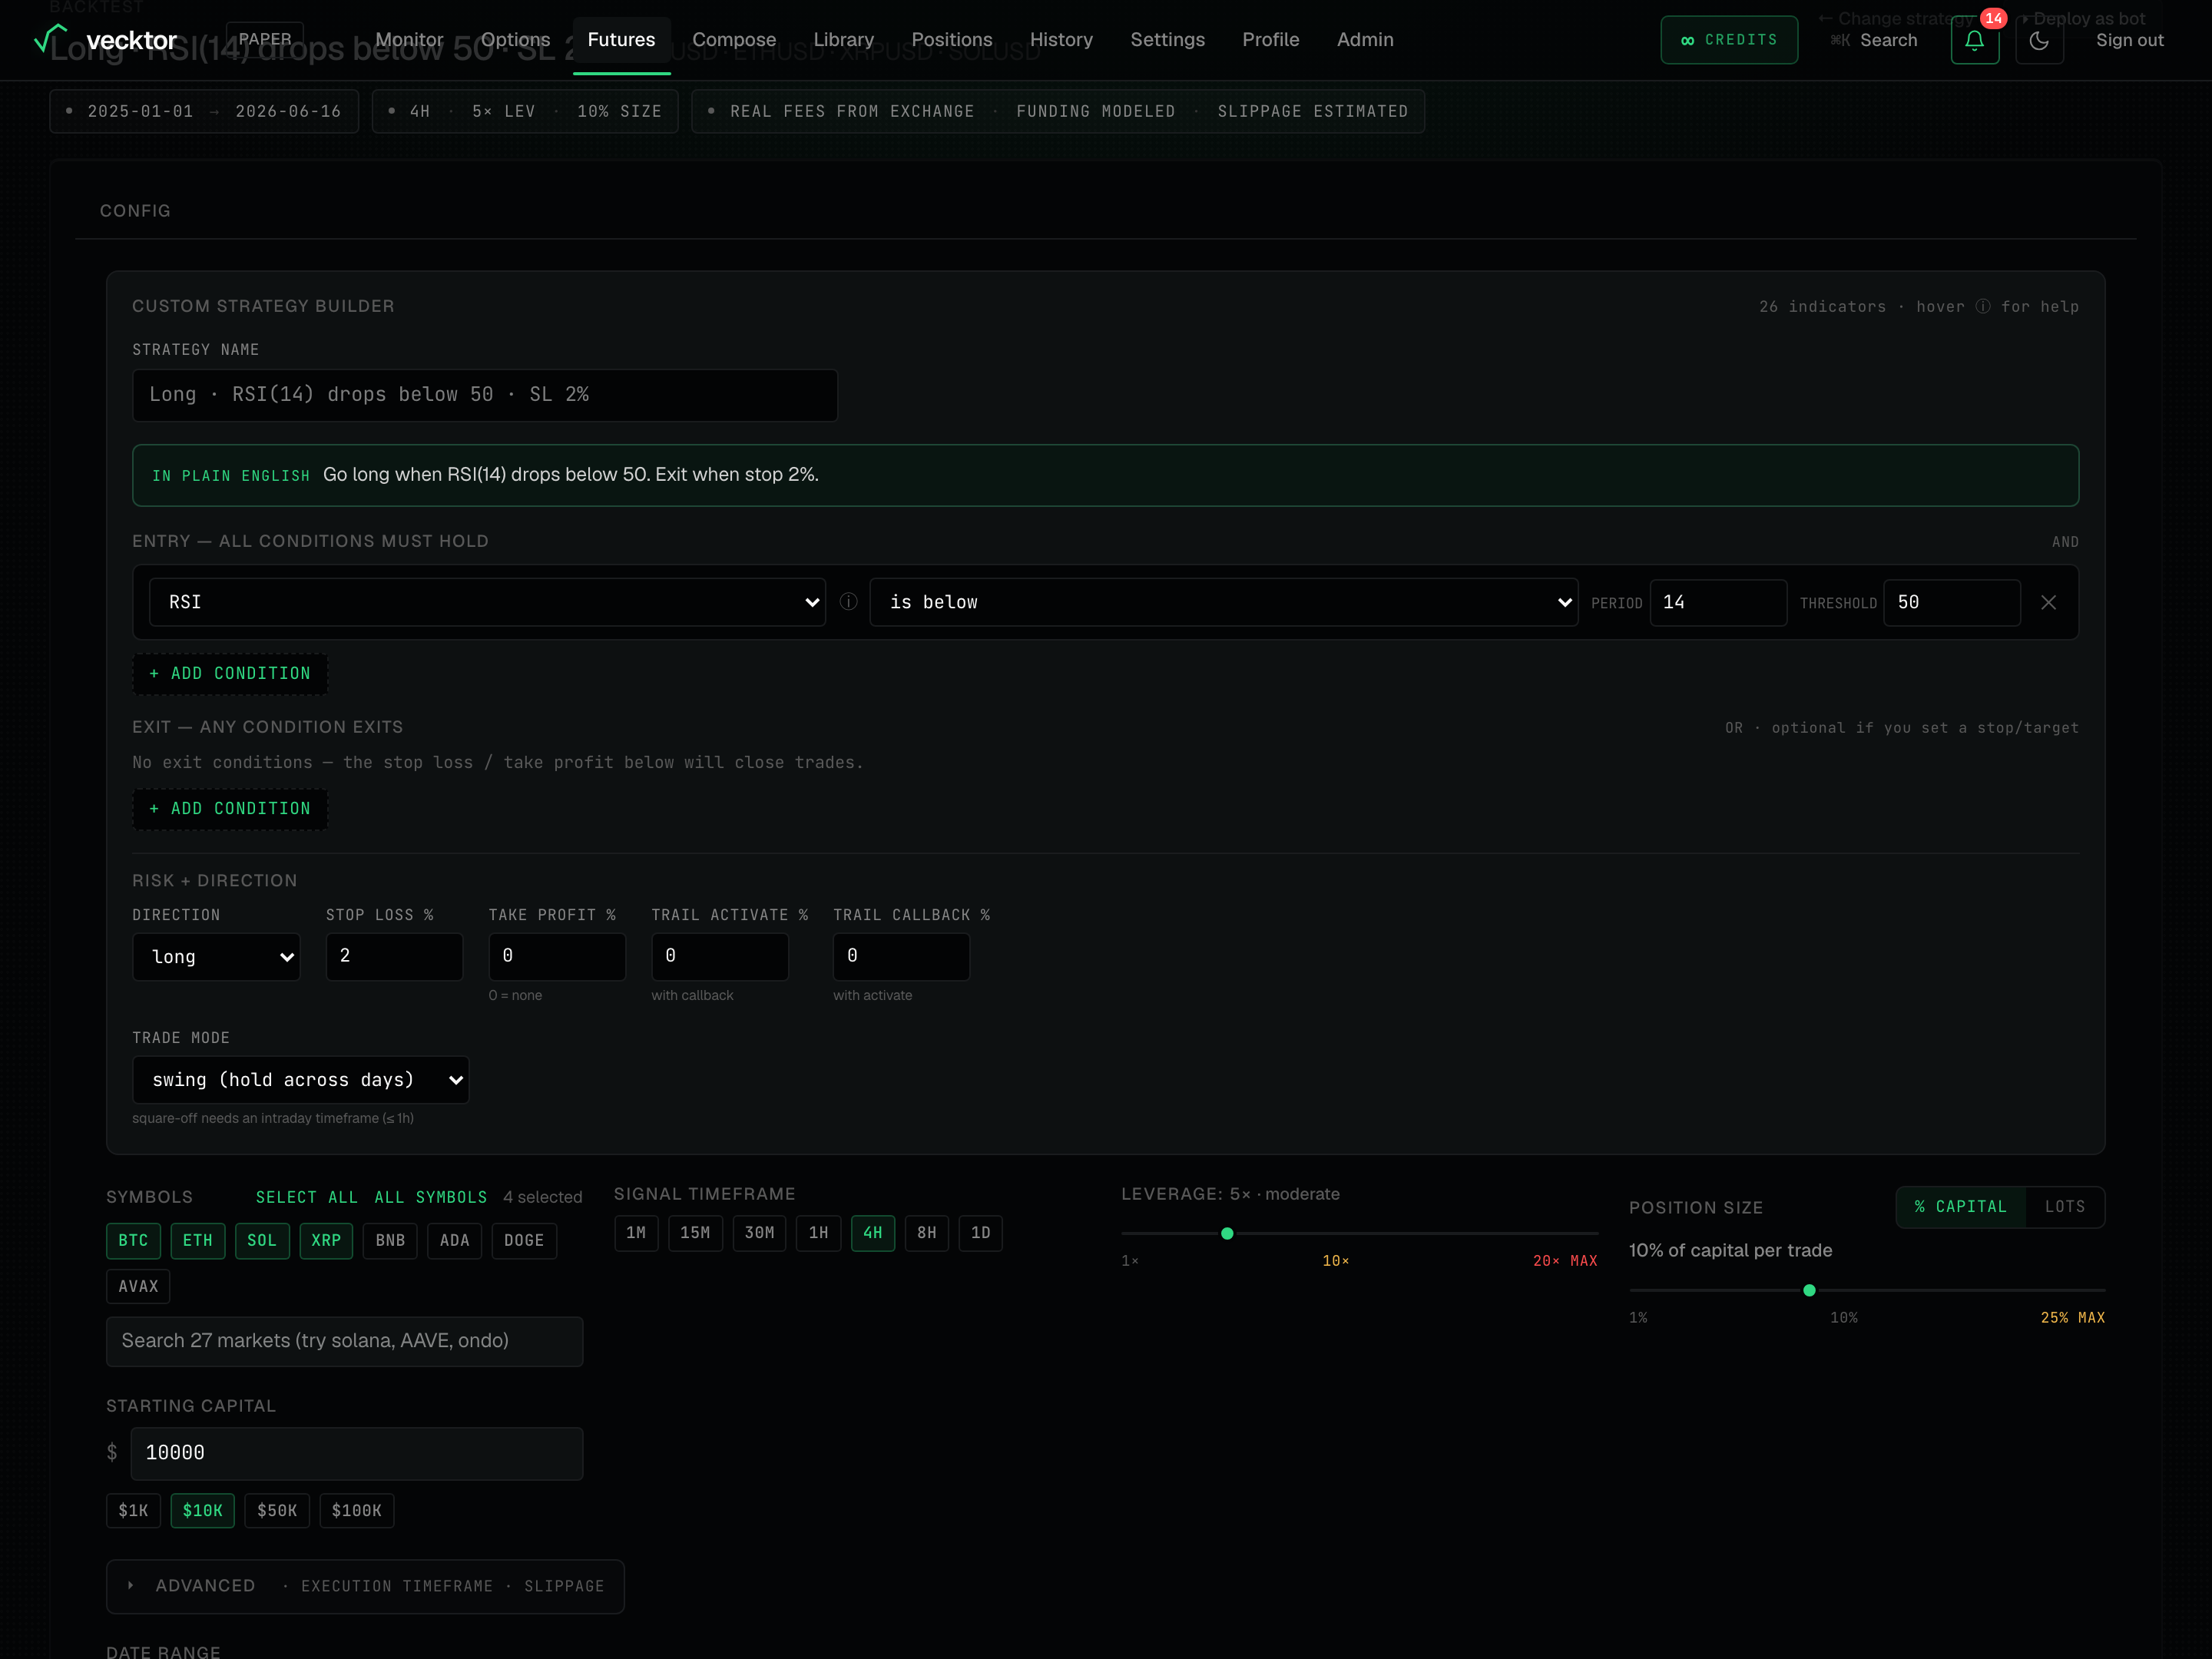
Build a custom strategy
The Custom Strategy Builder lets you assemble entry and exit rules from 27 indicators, with no AI involved.
- Type a STRATEGY NAME, or leave it blank to auto-name it from your rules.
- In the Entry section (labelled "all conditions must hold", joined by AND), add a condition from the indicator list. Hover the ⓘ next to an indicator for a plain explanation.
- In the Exit section (labelled "any condition exits", joined by OR), add exits if you want them. They are optional if you set a stop or target.
- In Risk + direction, set DIRECTION (long, short or both), plus STOP LOSS %, TAKE PROFIT %, and the TRAIL ACTIVATE % / TRAIL CALLBACK % pair (a trailing stop tightens as the trade moves your way).
- Set TRADE MODE: "swing (hold across days)" holds across days, "intraday (auto square-off)" closes the position each day at the SQUARE-OFF (IST) time. Intraday needs an intraday timeframe (1h or finer).
- Read the In plain English line. It restates your rules as you build, so you can sanity-check them.
The 27 indicators you can build from
Each condition picks one indicator, an operator (like crosses above or is below), and its parameters. Hover the ⓘ next to any indicator for a one-line explanation. The full catalog, grouped by what it measures:
- Trend and moving averages: EMA, SMA, DEMA, TEMA, HMA, MA slope, EMA cross, SMA cross, Supertrend, Parabolic SAR.
- Cloud and candles: Ichimoku Cloud, Heikin Ashi.
- Momentum and oscillators: RSI, Connors RSI, Stochastic, Williams %R, MACD, ROC (rate of change).
- Range and trend strength: CCI (Commodity Channel Index), ADX (trend strength, 0 to 100).
- Volatility and channels: ATR (Average True Range), Bollinger Bands, Keltner Channel, Donchian Channel.
- Volume: OBV (On-Balance Volume), VWAP (Volume-Weighted Average Price).
- Session and time: ORB (Opening Range Breakout) - set an opening-range start and end time (IST) and trade the break above the range high (long) or below the range low (short). Use an intraday timeframe like 1m or 5m so the range has enough bars.
 127 indicators to build from (hover ⓘ for help)2Entry rules (joined by AND)3Add a condition, then pick an indicator
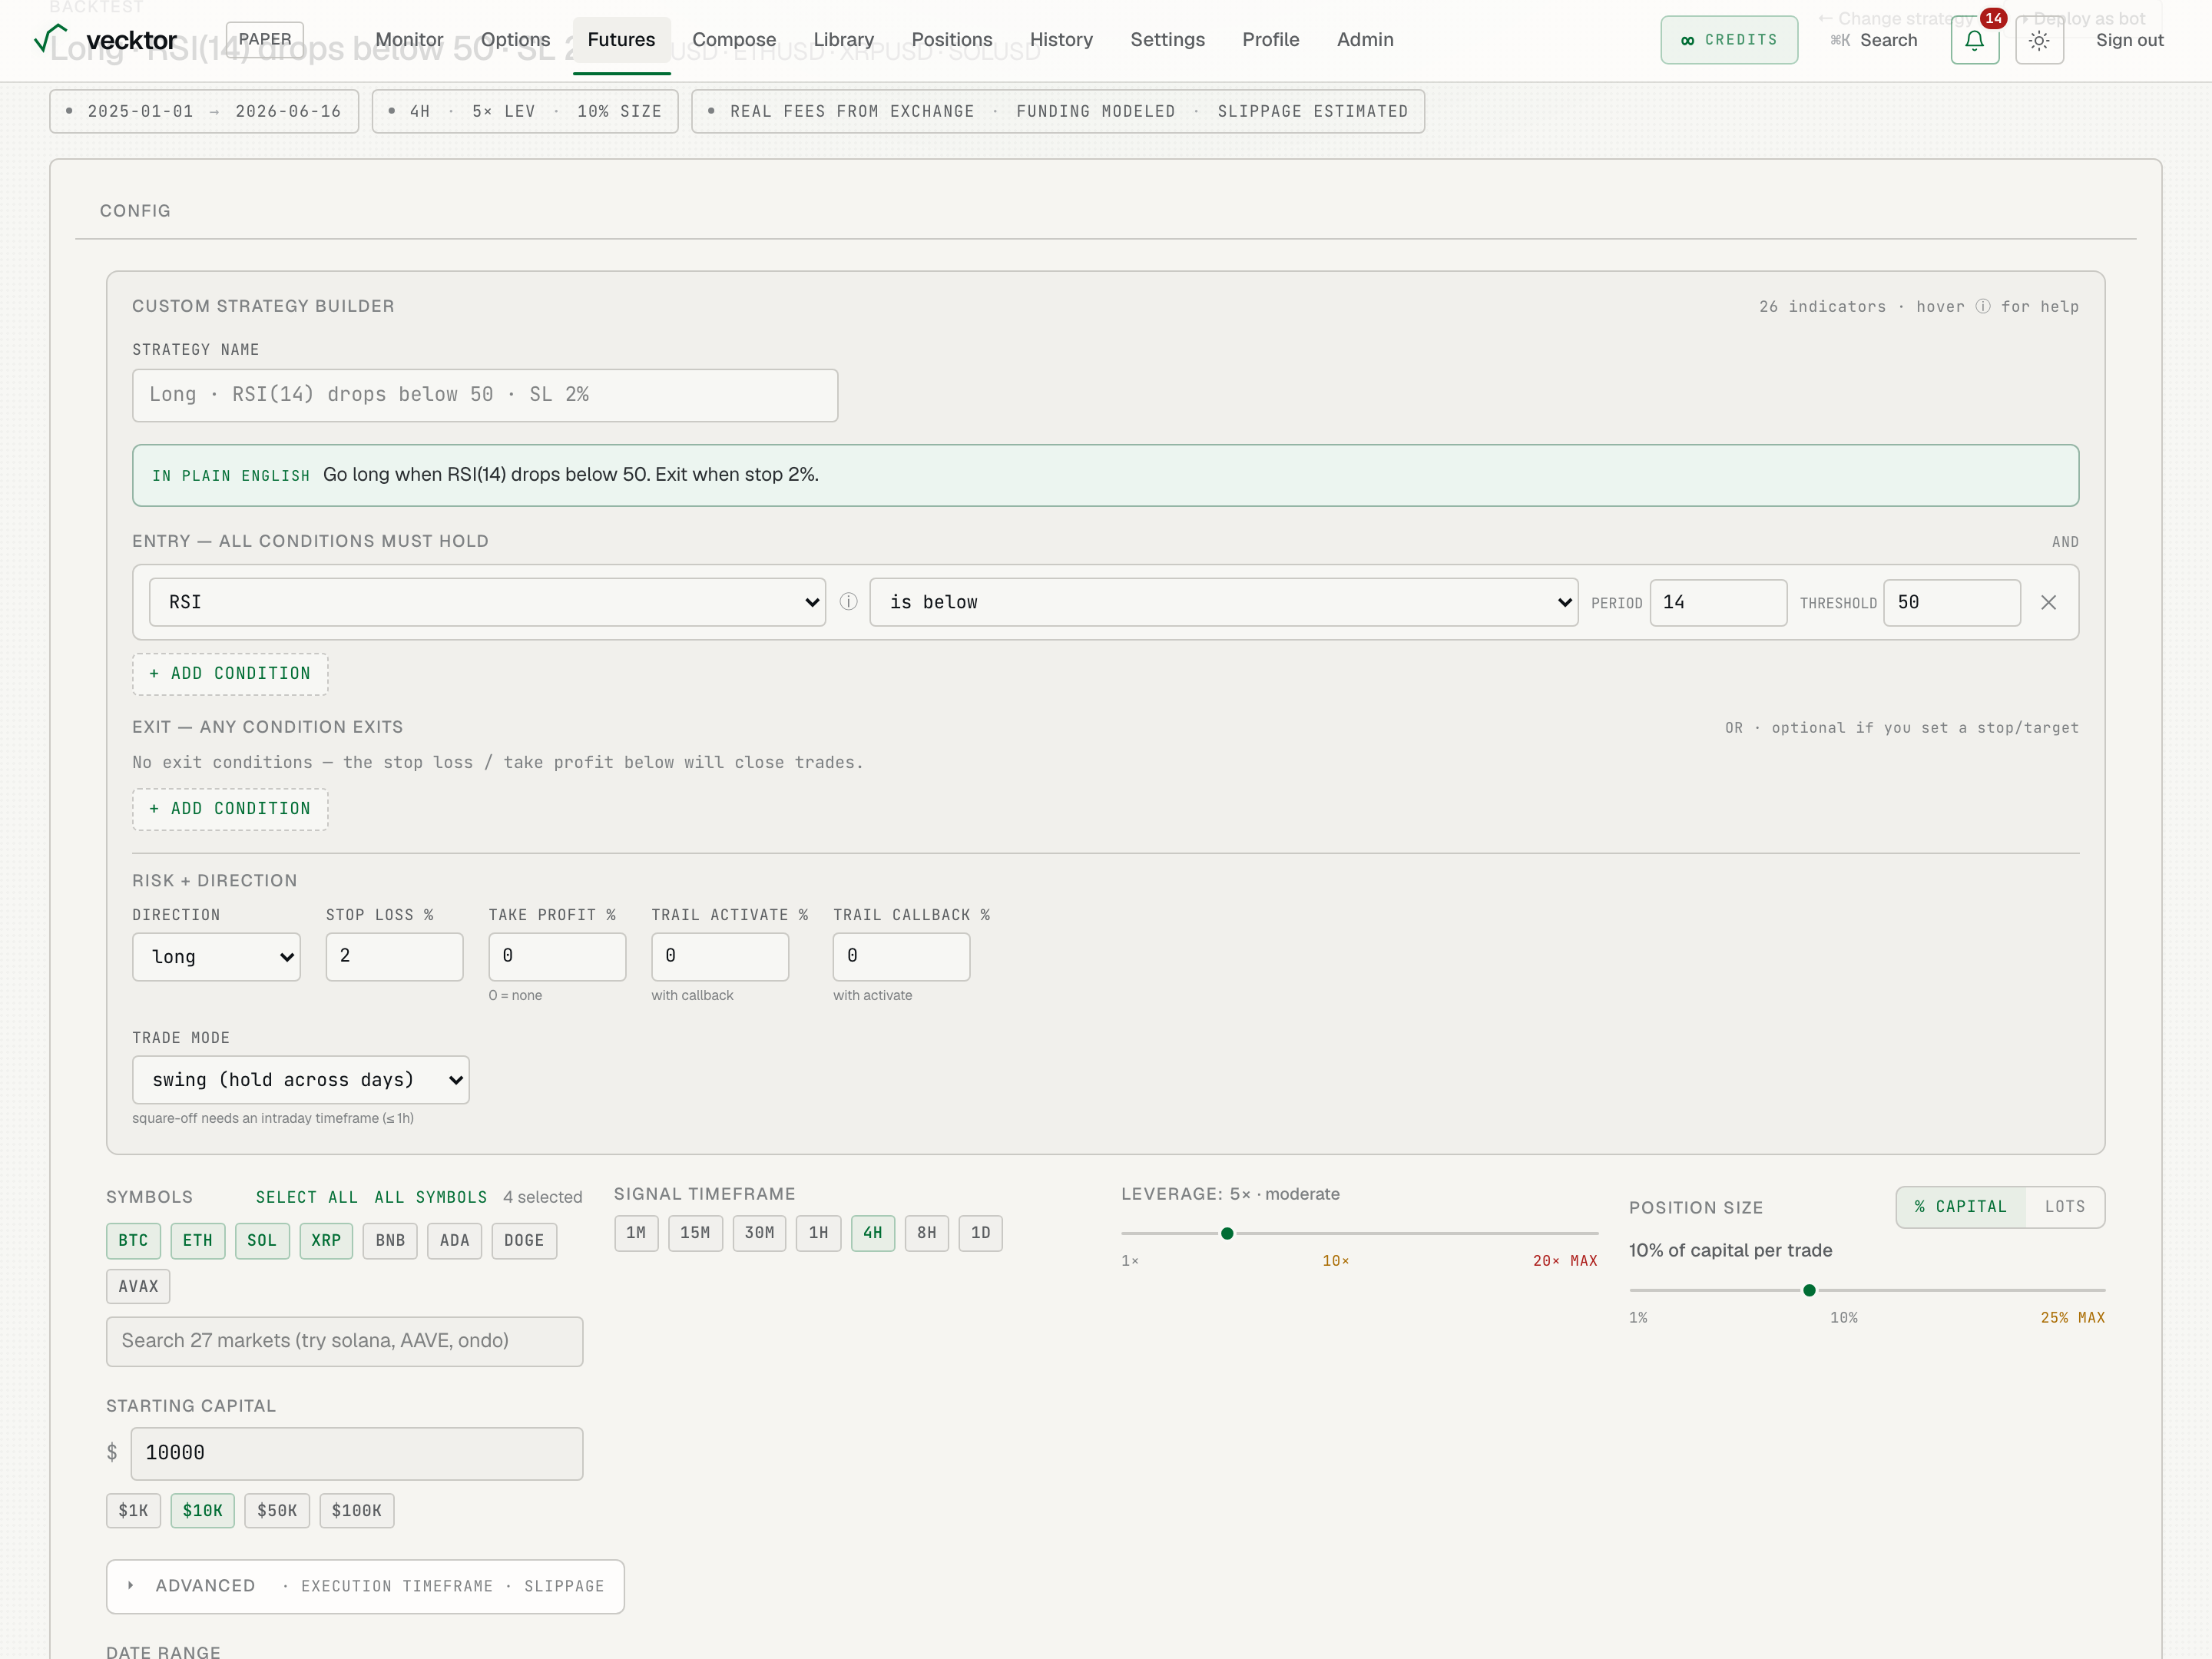
Edit the strategy params
On the Tune step, a ready-made strategy exposes its tunable numbers (periods, thresholds, risk percent) in a Strategy params editor.
- Open Strategy params on the Tune step.
- Adjust the periods, thresholds and risk percent inline.
- Run the backtest to compare. To change the logic itself (add or remove conditions, swap indicators), go back to Compose and adjust the prompt.
 1Tune periods, thresholds, risk
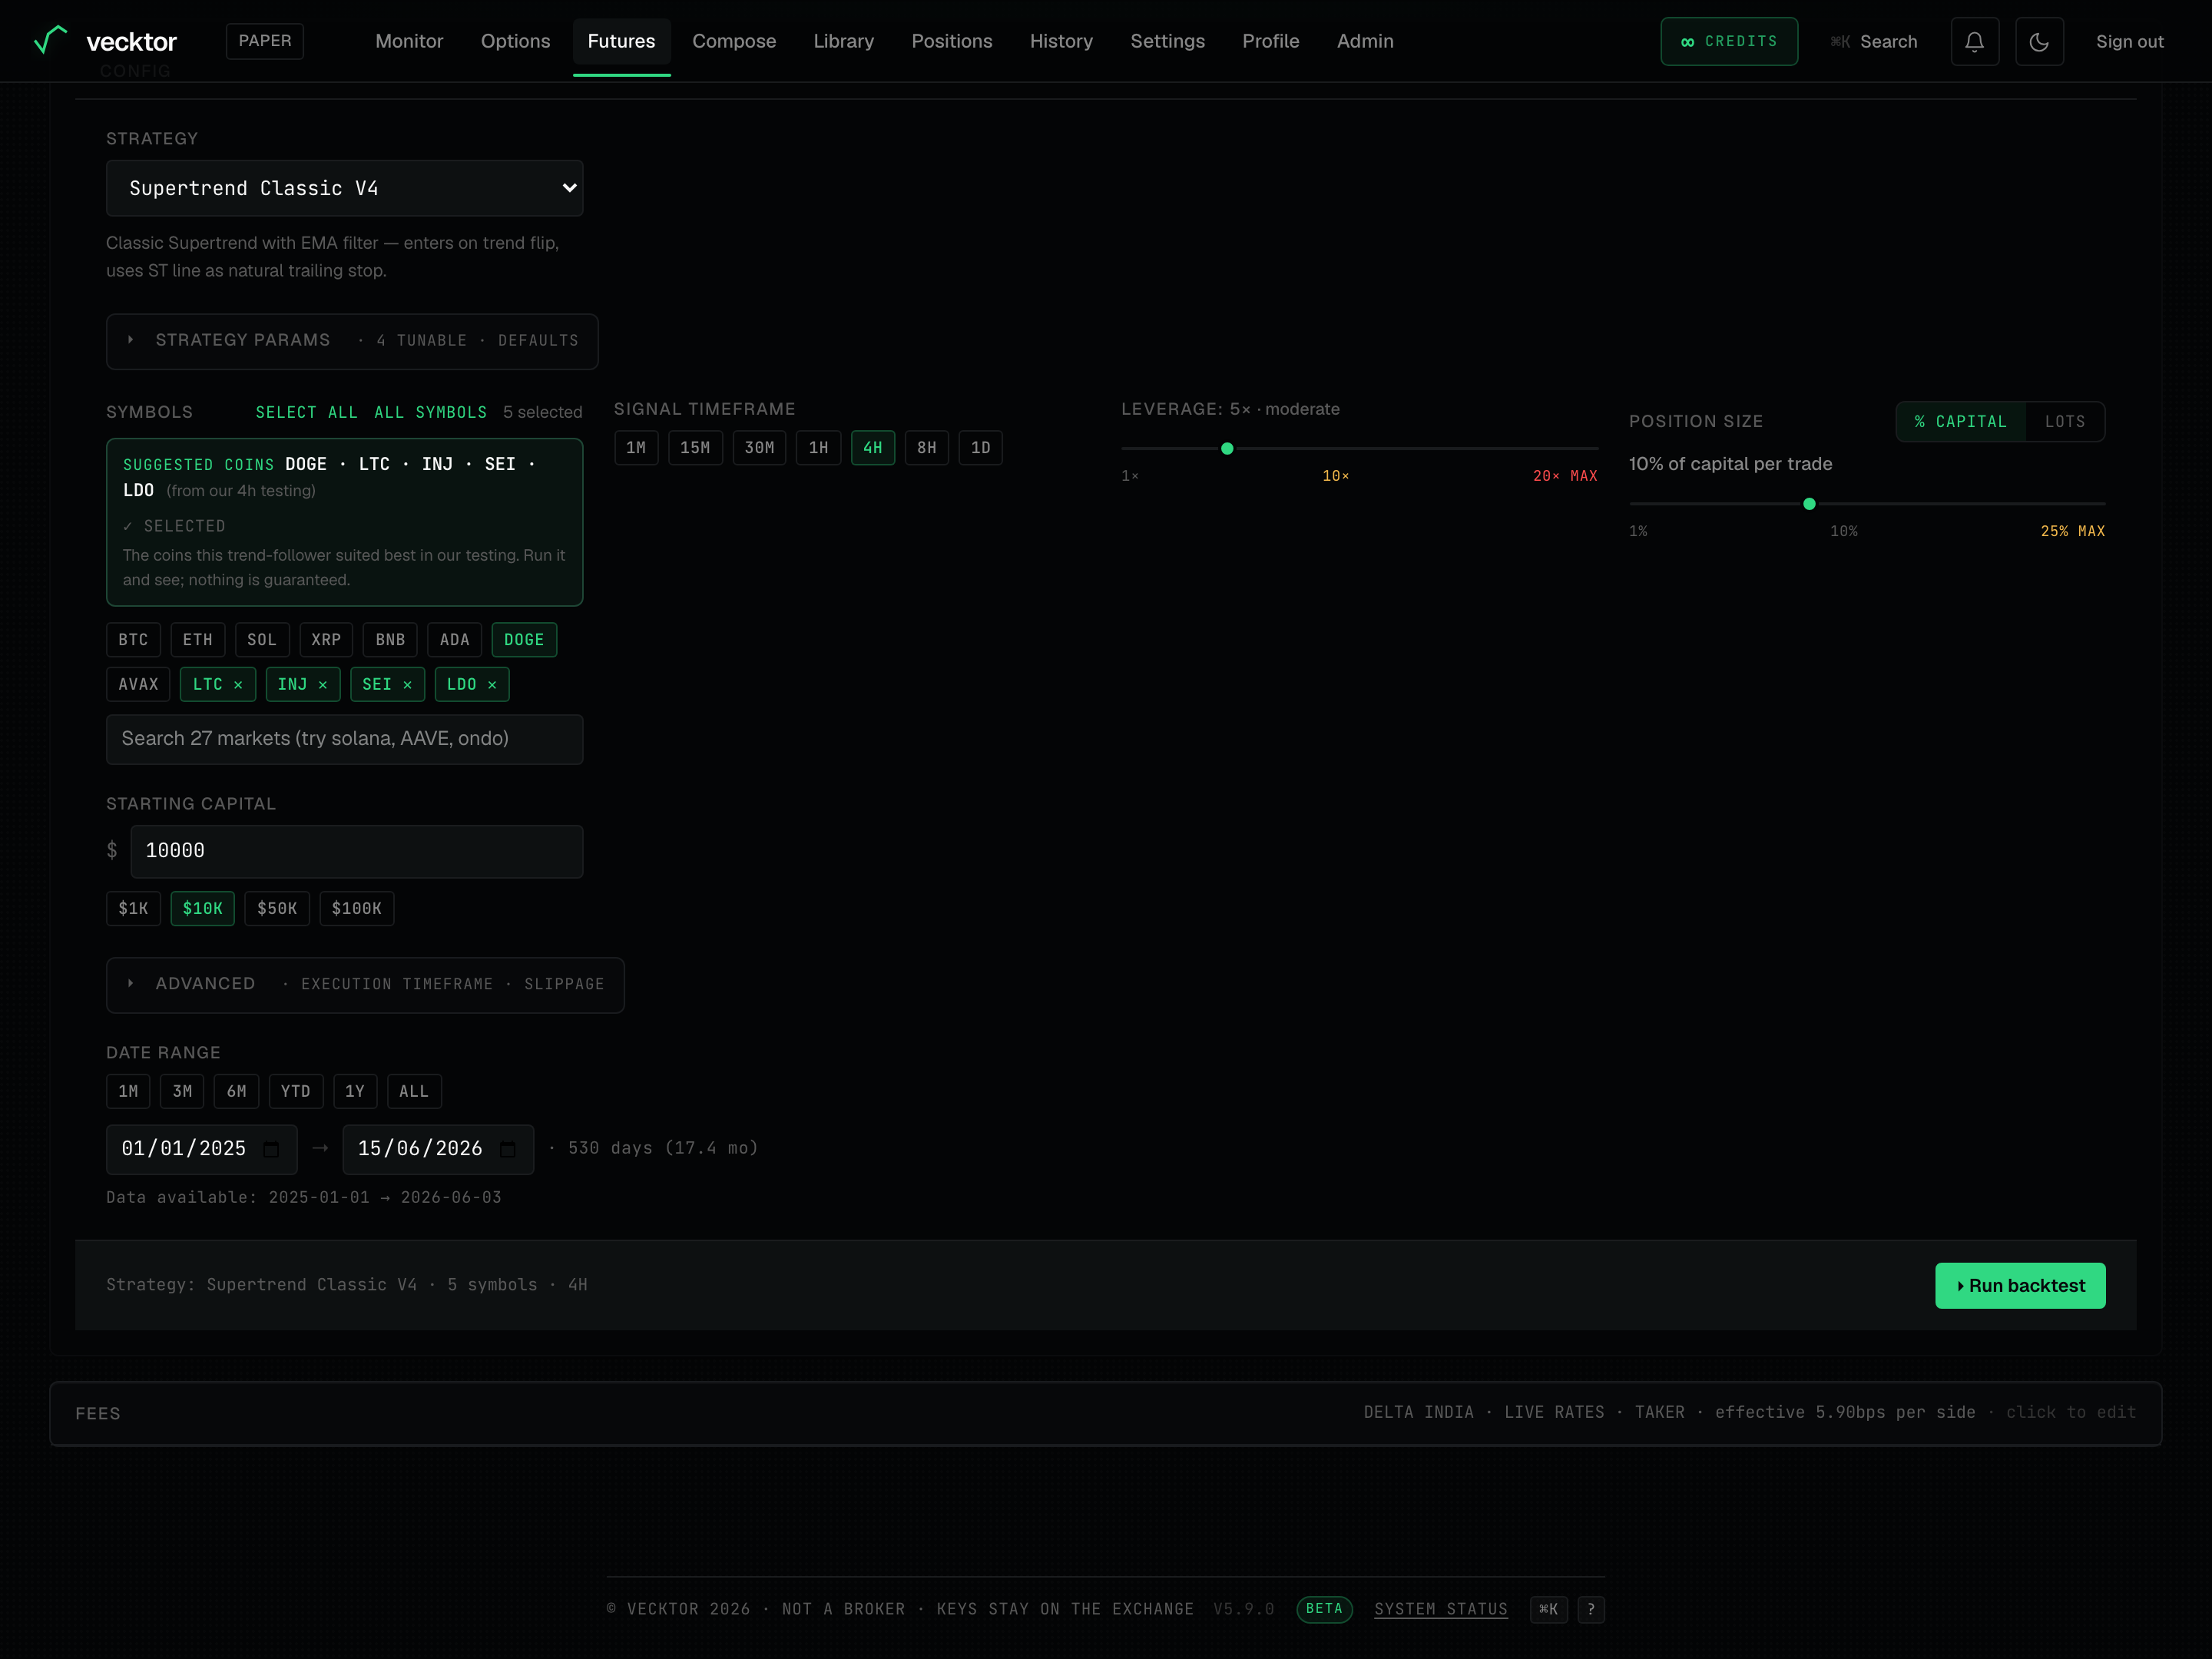
Choose coins and timeframe
On the Tune step the Symbols block is where you pick which markets to test, and Signal timeframe sets the candle size the signals fire on.
- Tap a coin chip to toggle it. The "X selected" count shows how many are on.
- Use Select all or All symbols to grab many markets at once, or the search box (placeholder "Search 27 markets (try solana, AAVE, ondo)") to find a long-tail coin.
- If a Suggested coins box shows, click Use these to add the coins this strategy tested best on. It is a hint, not a forced pick.
- Pick a Signal timeframe chip (the candle size signals are read on): 1M, 15M, 30M, 1H, 4H, 8H or 1D.
 1Toggle markets / Select all2Candle size signals fire on
- Toggle the coins (BTC on, add more as needed)
- Click Use these on Suggested coins (where this strategy tested best)
- Confirm the Signal timeframe (the strategy snaps to its designed one)
- Set Leverage (it magnifies gains and losses)
- Set Position size (% Capital or Lots)
Set leverage, size and capital
These inputs frame how big each trade is and how much capital it is measured against.
- Drag the Leverage slider from 1× to 20×. The label reads conservative, moderate, aggressive or very high risk as you move; 10× and 20× MAX are marked in warning colors.
- Under Position size, pick % Capital (a slider for percent of capital per trade, 1% to 25%) or Lots (a fixed number of lots per trade).
- If you use Lots, note the helper line: 1 lot is the exchange contract size per symbol (for example 0.001 BTC). Leverage still applies to margin.
- Set Starting capital so returns show as a percent of a real number. The results rescale to it on the next run.
 11x to 20x MAX2% Capital or Lots3Returns measured against this
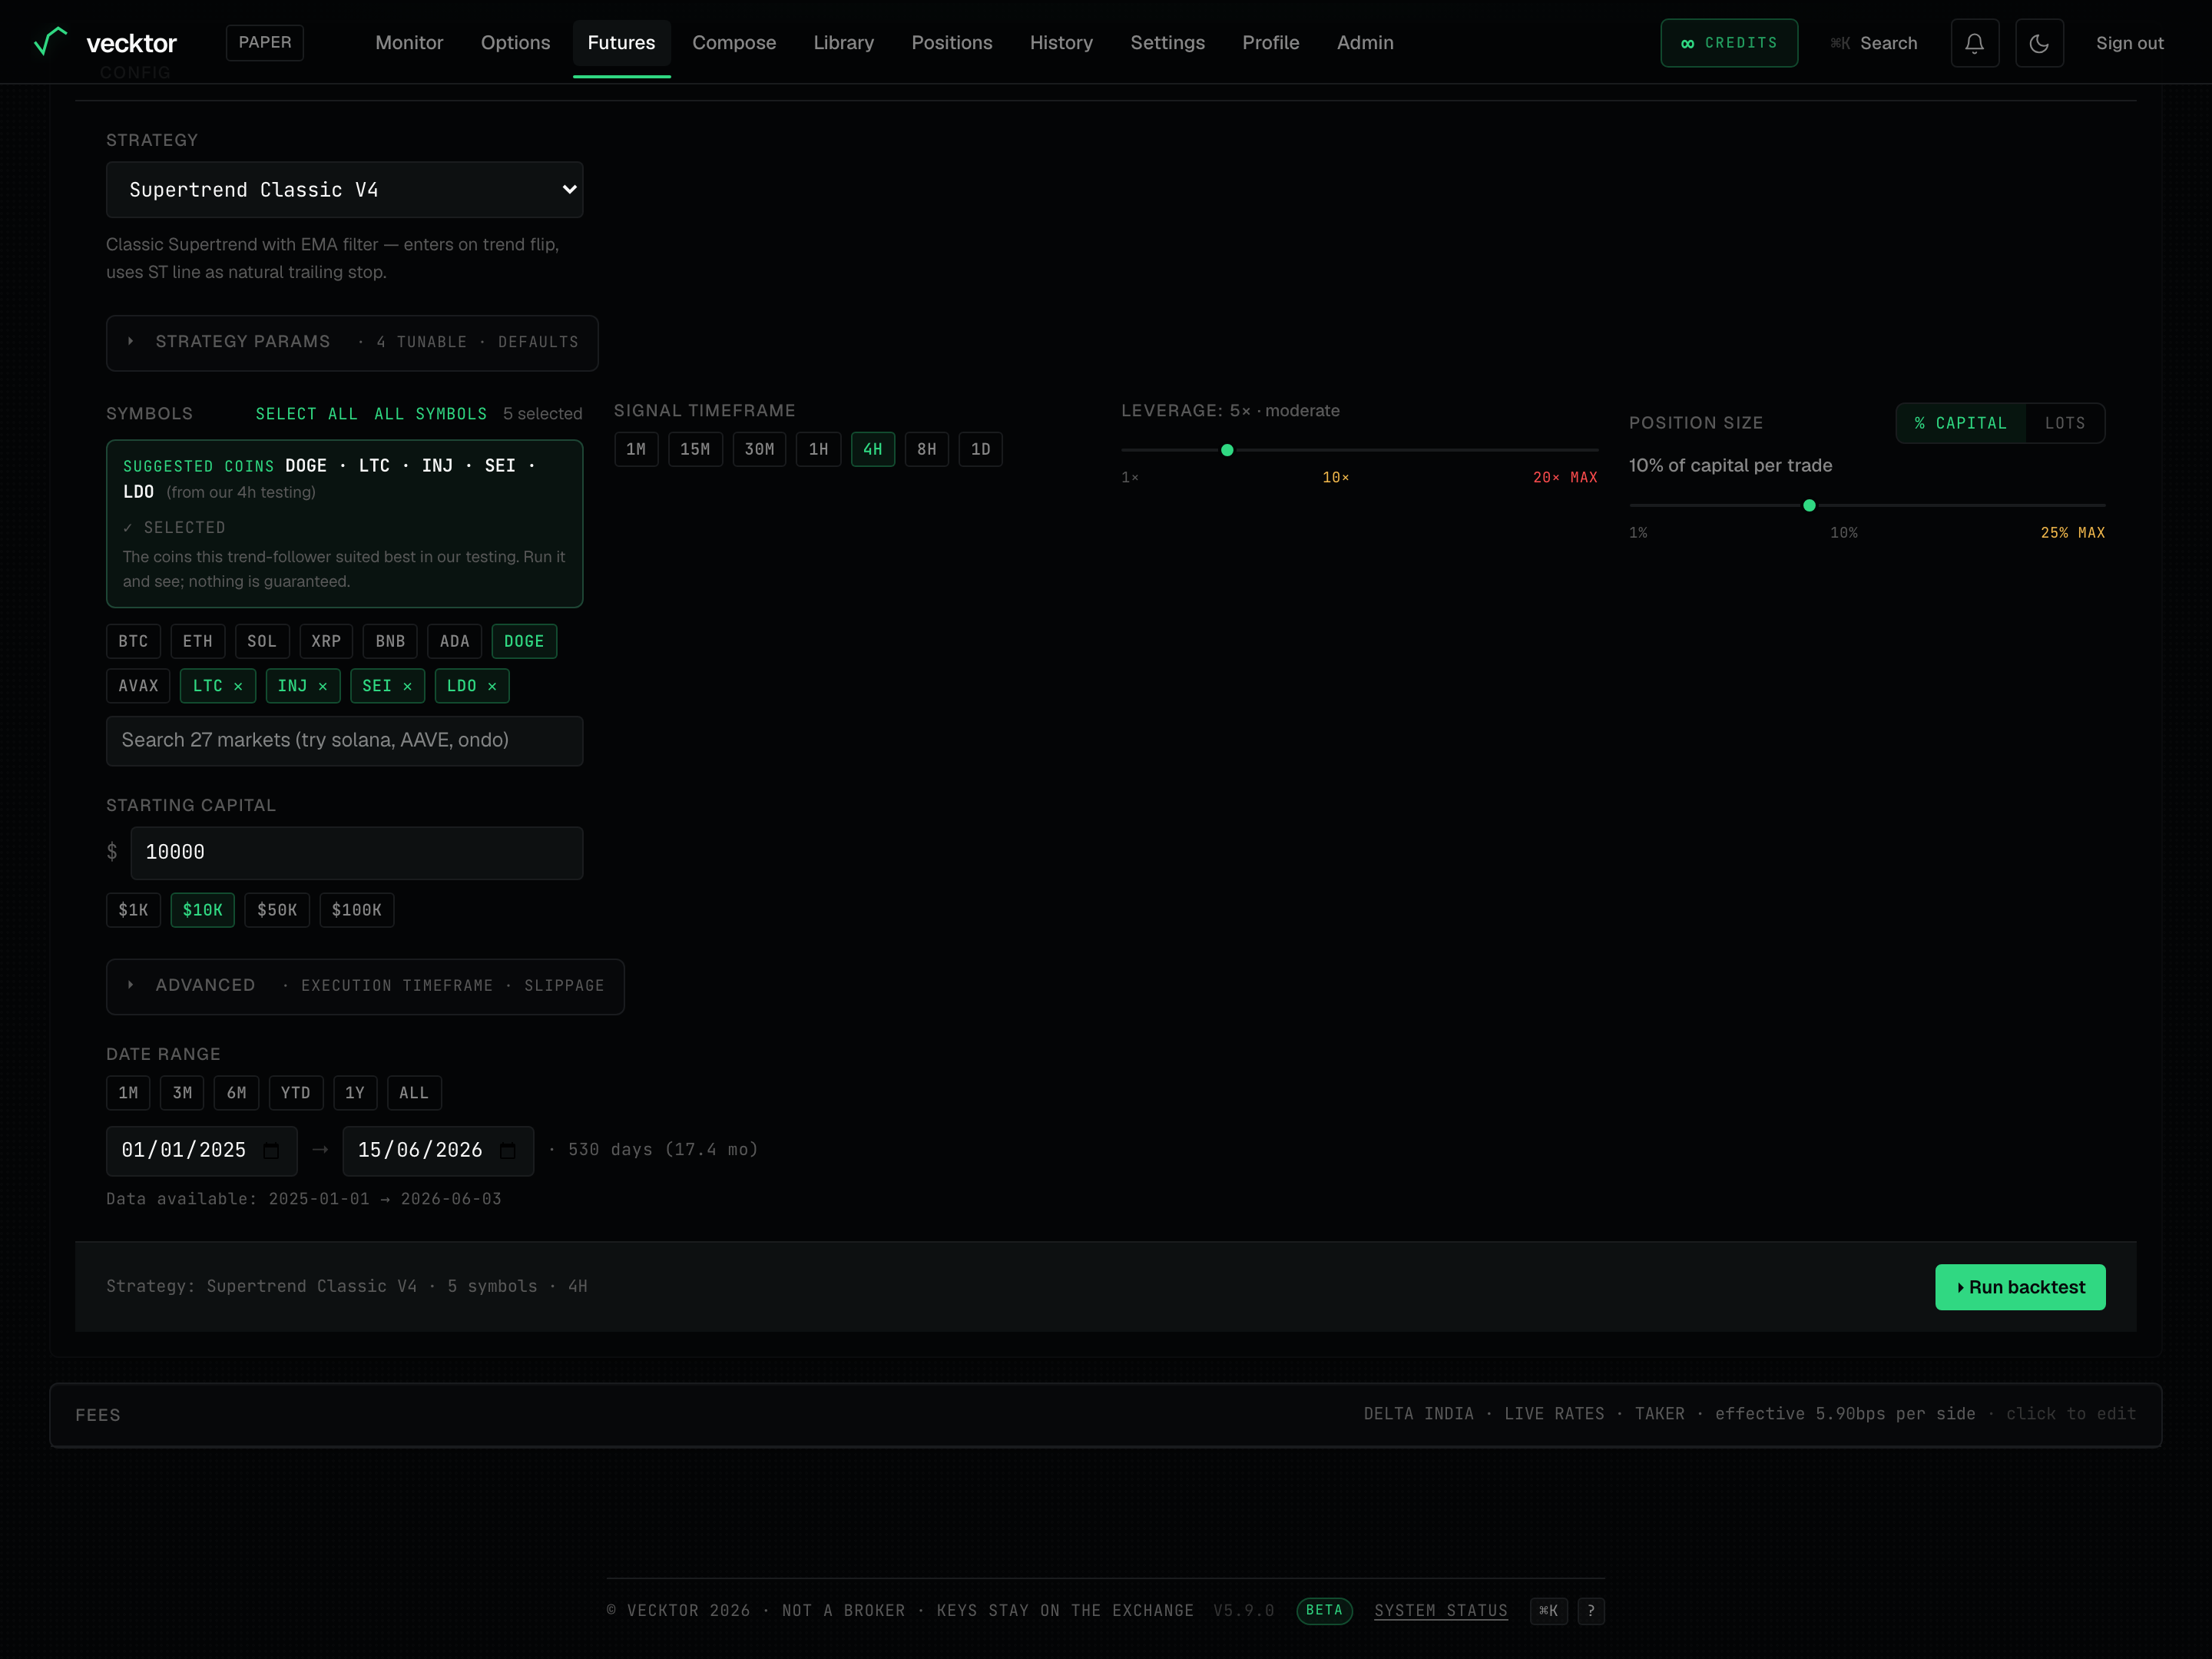
Set fees, slippage and the date range
Vecktor models real costs so the result is honest, not optimistic. The execution timeframe and slippage live under Advanced.
- On the Fees card, leave the Preset on "Delta India (current)", or switch the Assumed fill side (All taker, All maker, or Mixed) to model a different cost.
- Open Advanced to set Slippage (the gap between the price you expect and the price you get), 0% to 1%. 0 is optimistic; 0.25 to 0.5% is realistic for liquid majors, more for thin alts.
- In Advanced, the Execution timeframe defaults to SAME AS SIGNAL; pick a finer one to resolve stop and target fills inside each bar (it only shows when the signal timeframe is above 1M).
- Set the Date range with the preset chips (1M, 3M, 6M, YTD, 1Y, ALL) or the two date fields. The span helper shows how many days you are testing.
 1Preset chips or two date fields2Slippage + execution timeframe
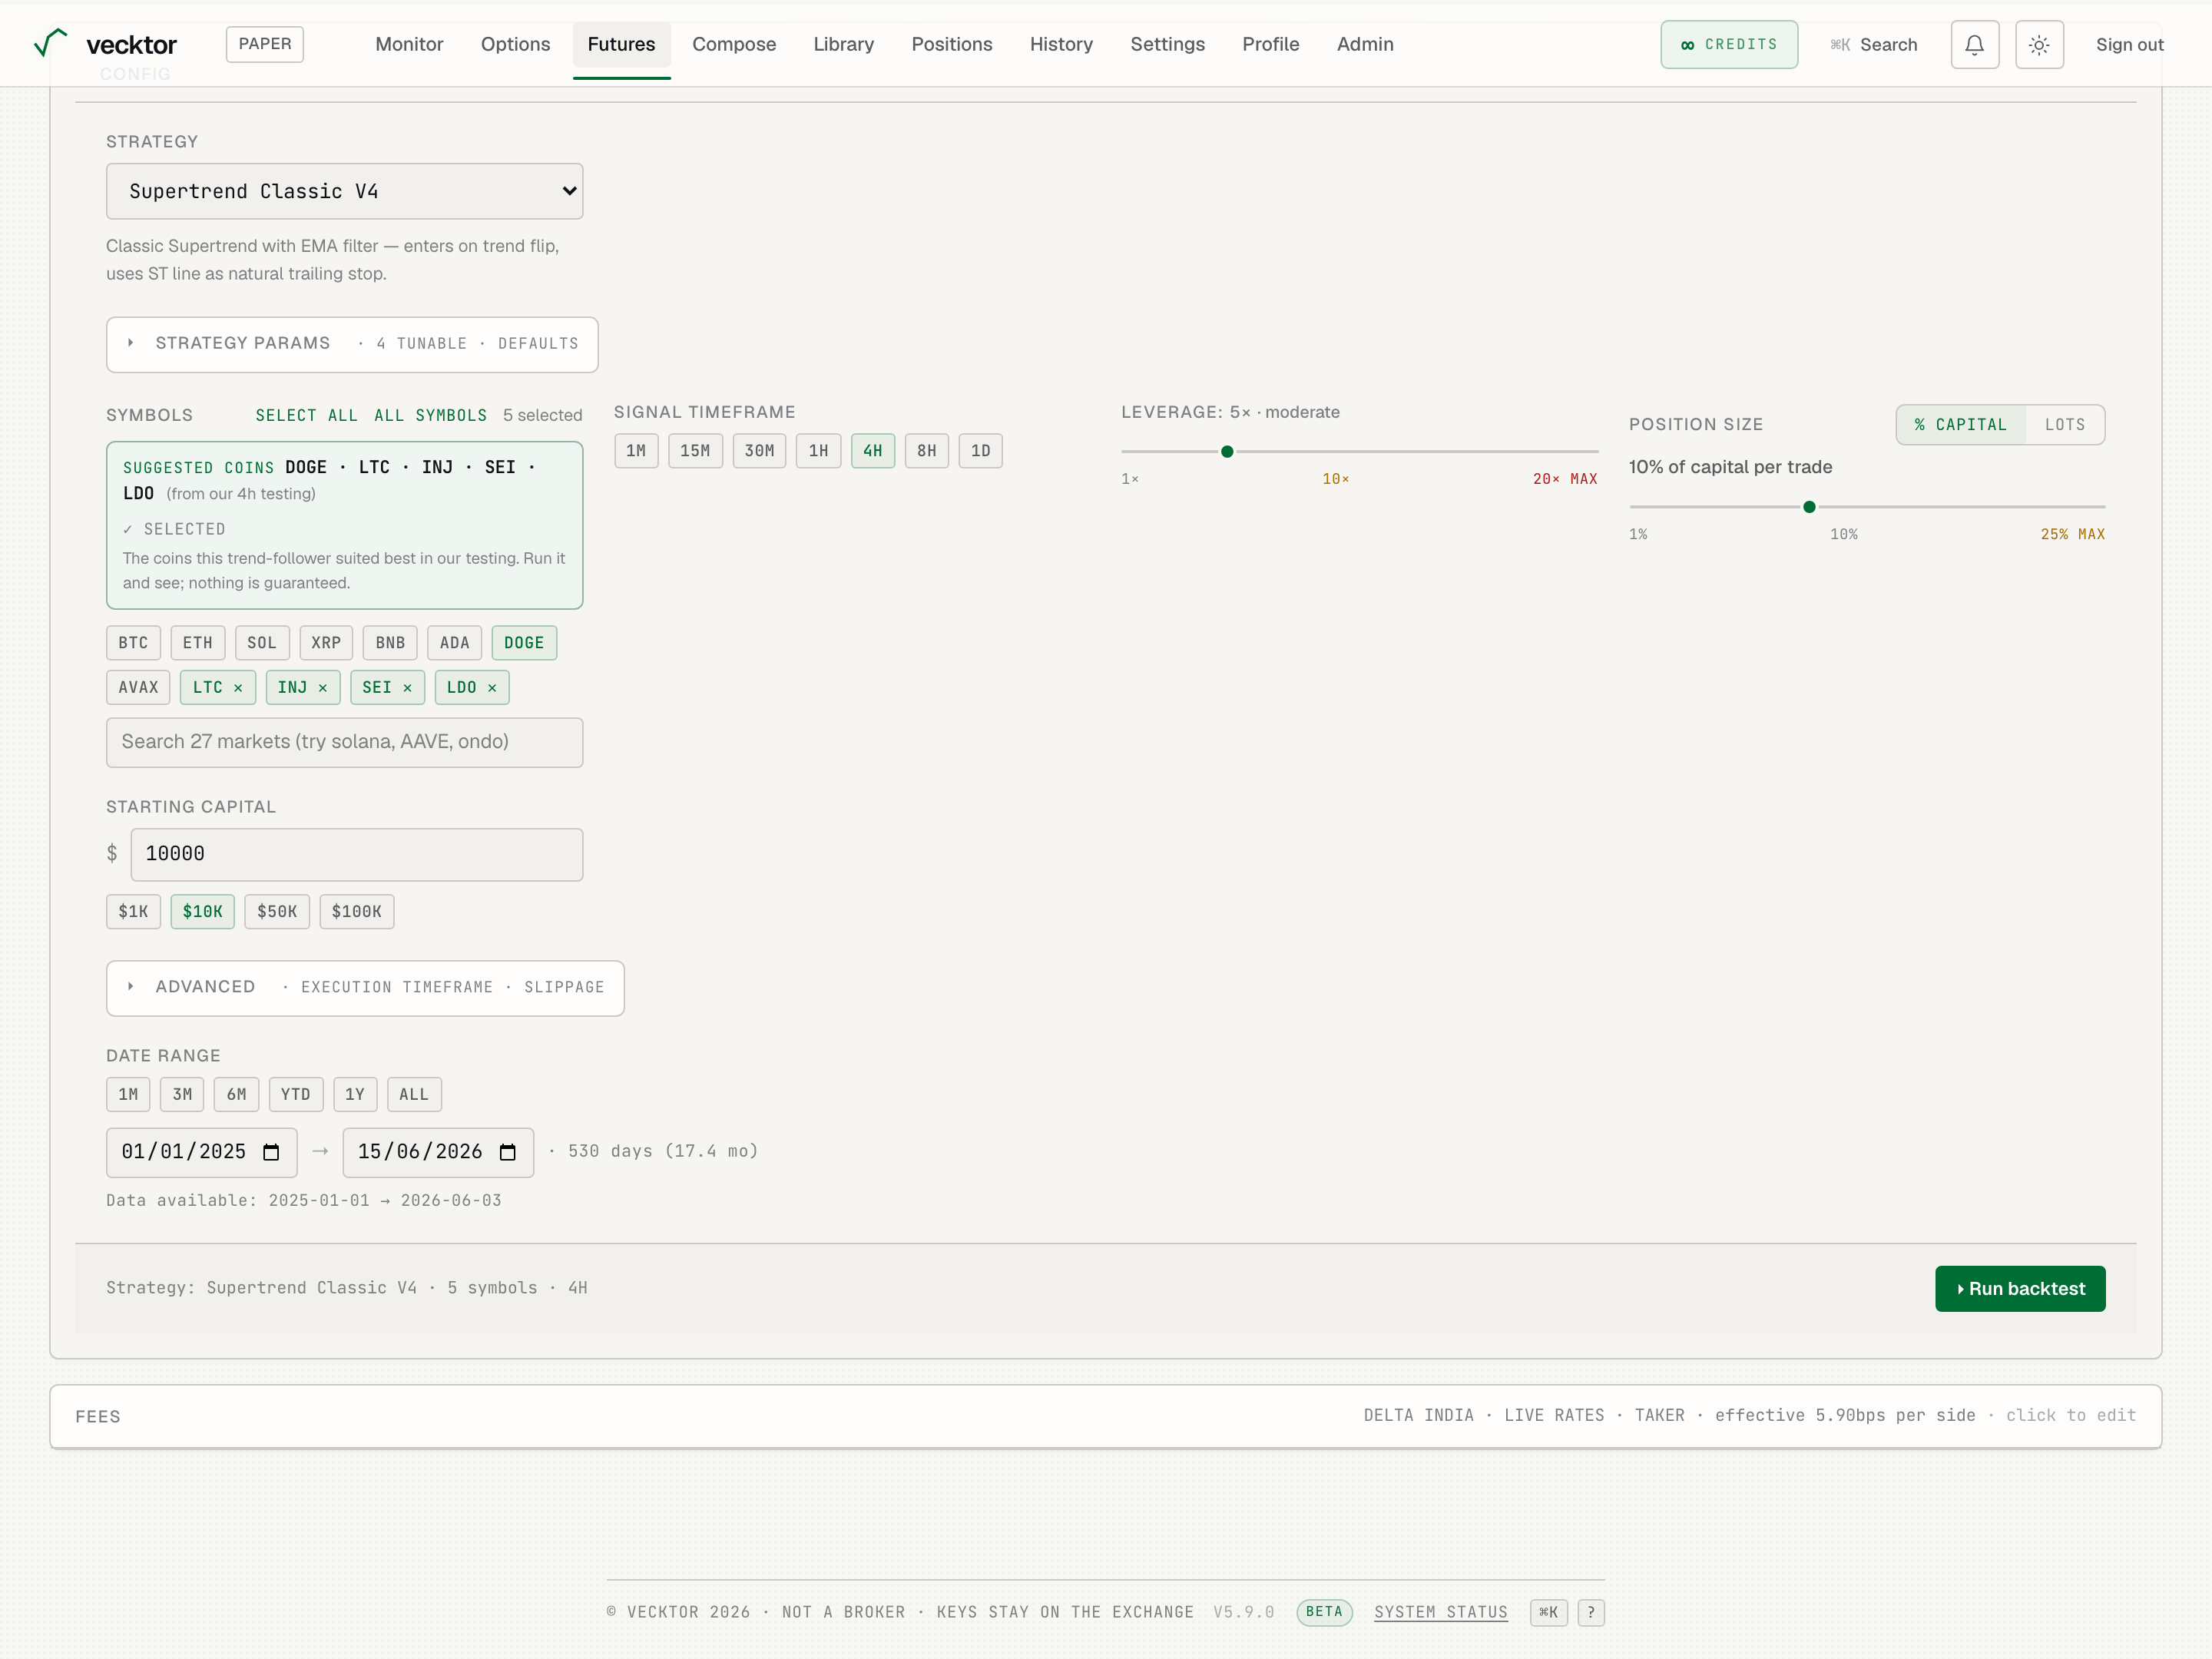
Choose the price source: LTP or MARK
Under Advanced you can choose which price the backtest fills at. This is unusual: most platforms only have one. Vecktor lets you test both.
- LTP (default): the last traded price, i.e. prices that actually printed on the exchange. This is the realistic "what would I really have filled at" view.
- MARK: Delta's continuous mark price, the smooth fair-value series the exchange uses for margin and PnL. It has denser coverage and no gaps, so it is steadier for thin or fast markets.
- Pick LTP to be conservative and realistic; pick MARK to compare against the exchange's own marked performance. Run both and see how far apart they are.
Run the backtest
Running starts your backtest and streams a progress bar by date.
- Click Run backtest (it sits at the bottom of the config and in the page header).
- Watch the progress fill. The flow jumps to Results so the metric strip lines up at the top.
- Run the same config again and it returns instantly from cache.
- A live price strip for your selected coins shows on every step, so the page feels connected to the market.
 1Start the backtest
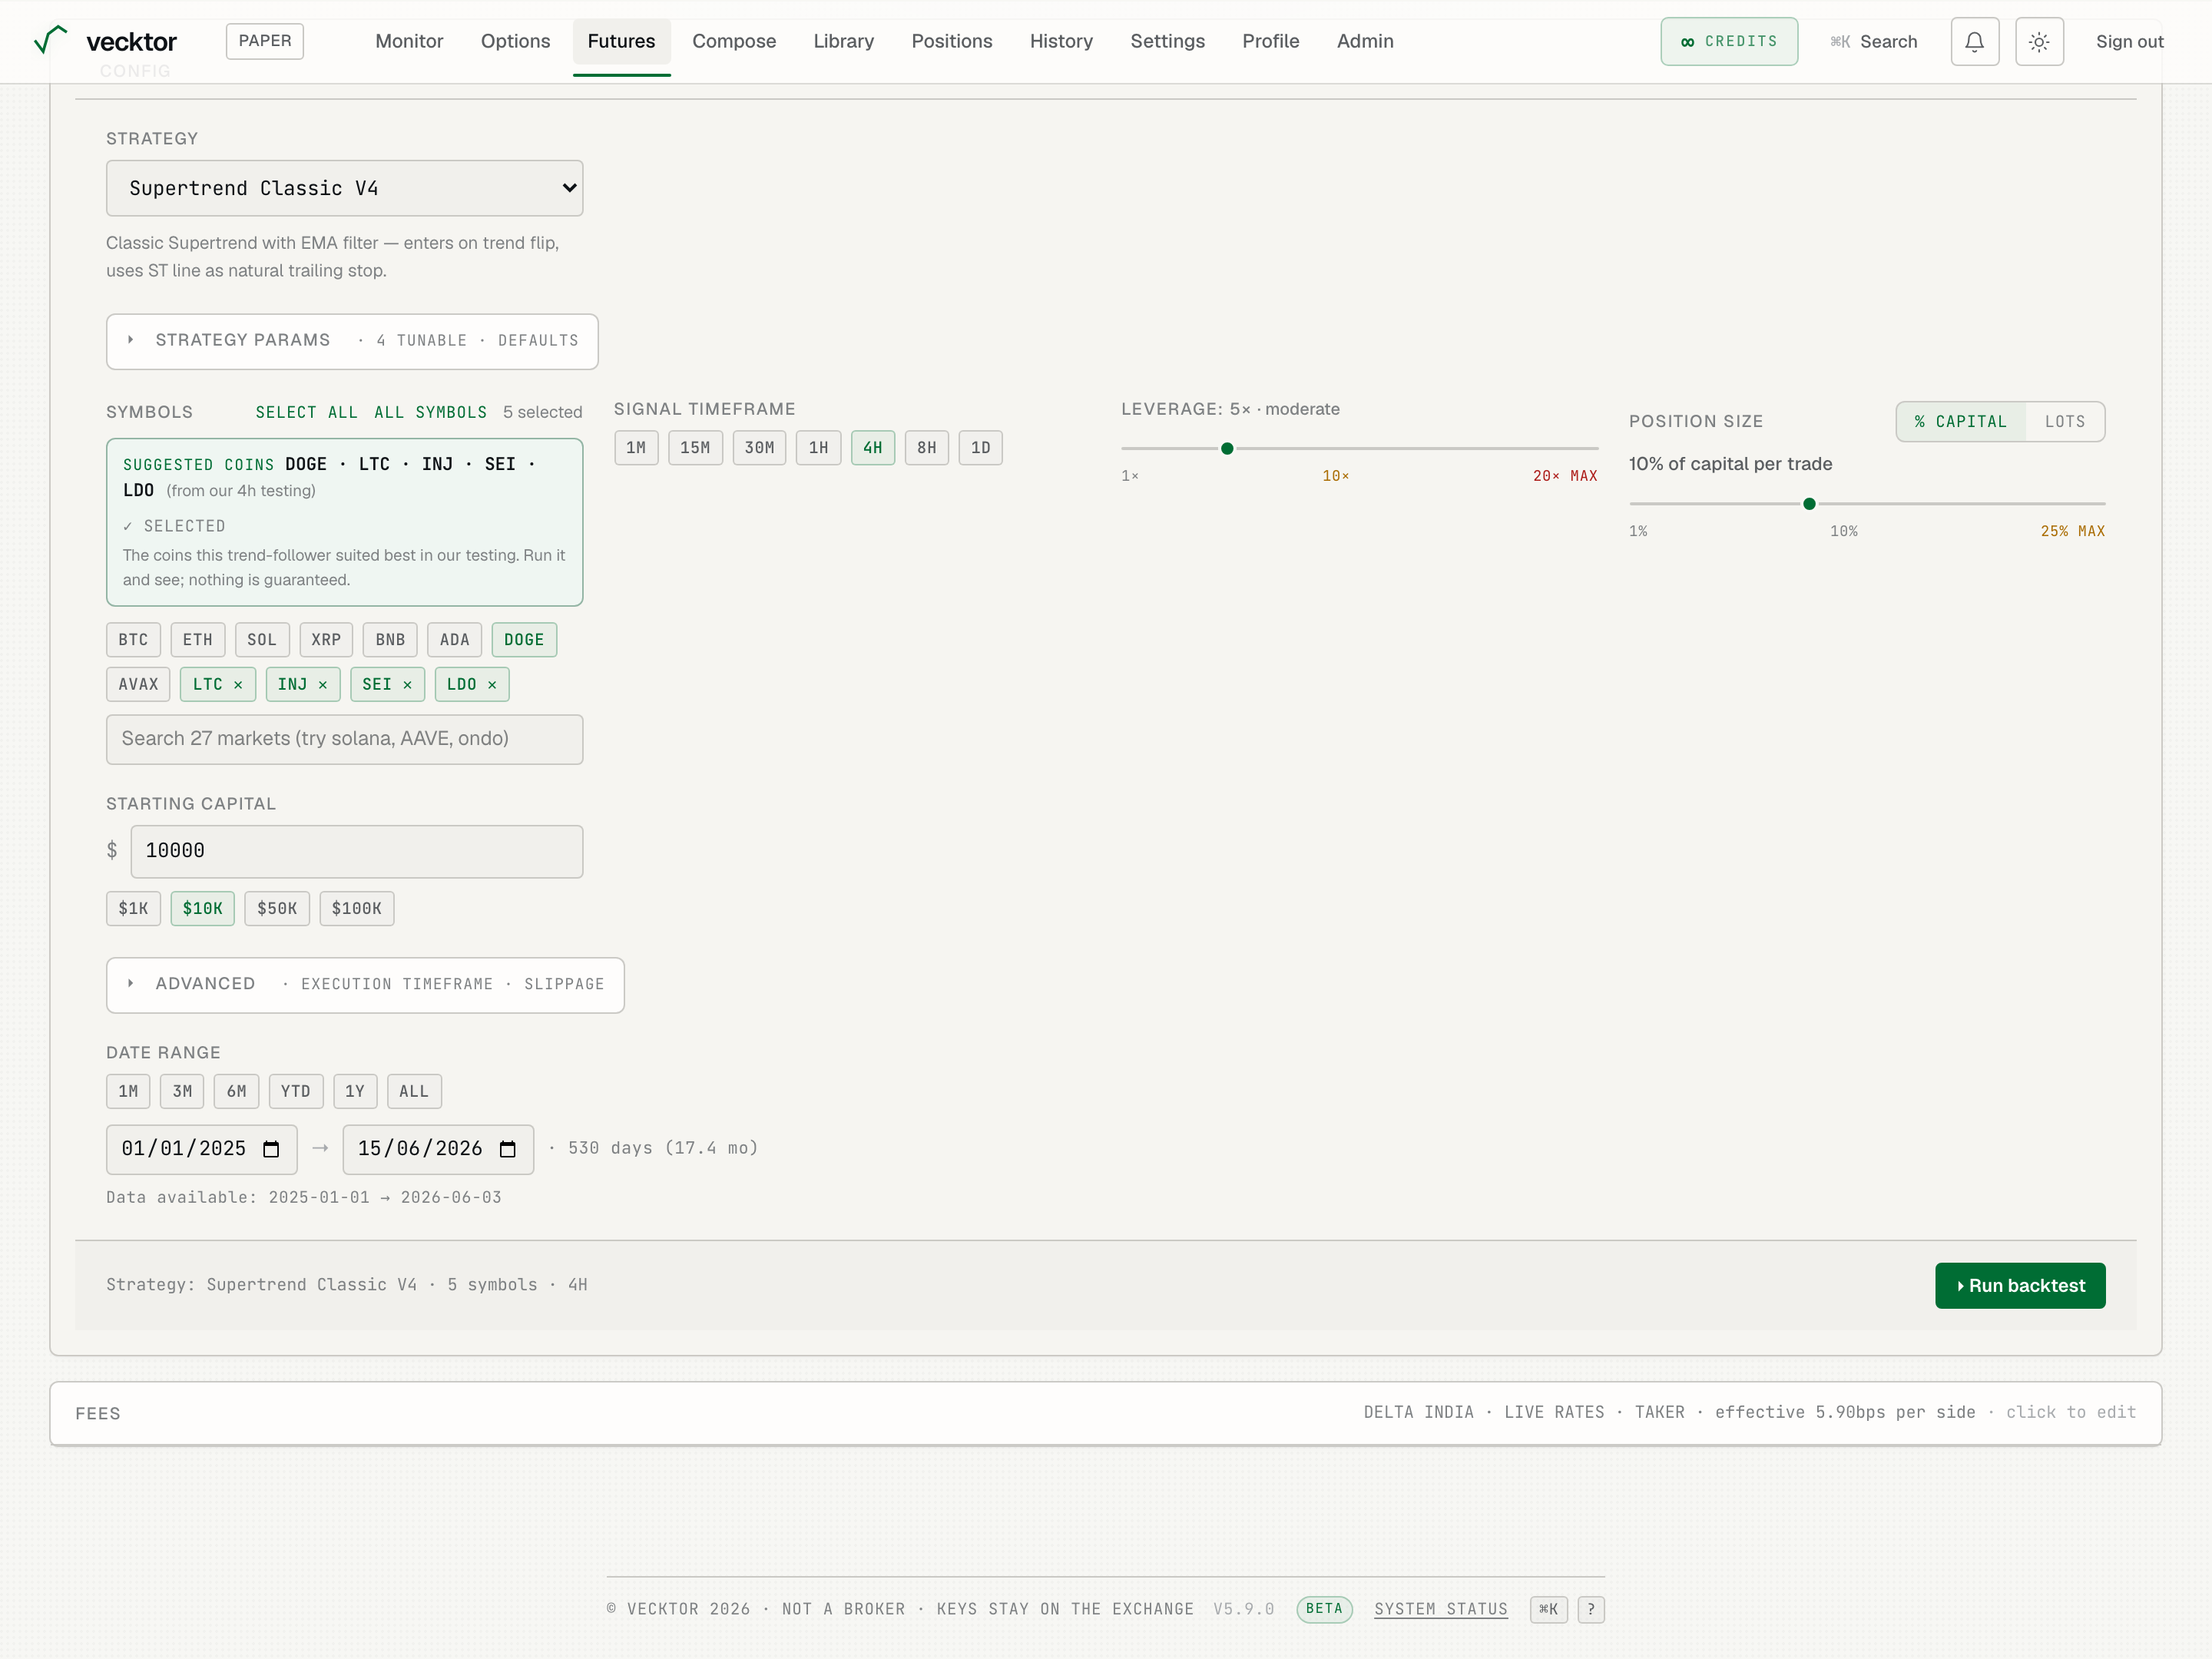
Read the results
Results open with a five-metric strip, then a cost callout, then a full breakdown.
- Read the top strip: Total return, Sharpe (return per unit of swing; above 1 is good), Max drawdown (the worst peak-to-trough drop), Win rate, and Trades. Each shows a second figure (Sortino, Calmar, Profit factor, expectancy).
- Check the green net-of-costs callout: it confirms returns are net of fees, funding and slippage, with the exact totals deducted.
- Read the Trade statistics for the deeper win/loss breakdown.
- Scan the calendar heatmap, the Monthly returns strip, and the Year-wise returns table to see month-by-month and year-by-year behavior.
- Read the Equity curve (your capital over time versus the coin) and the Drawdown chart below it.
- Read Monte Carlo (it reshuffles your trades thousands of times): the return range, the worst-case drawdown, and the probability of profit and of ruin.
- Open Per symbol and Exit reasons to see which coins carried the result and how trades closed. The top drawdown episodes table lists the worst stretches.
- Open the Trade log for every trade, with entry, exit, fees, funding and P&L per row.
- Read total return (after all costs)
- Check max drawdown (the worst peak-to-trough drop)
- See the cost callout (fees, funding and slippage already out)
- Scan the equity curve (your capital over time vs the coin)
- Read Monte Carlo (is the result luck or robust)
Ask the backtest analyst
A floating dock appears once you have a result, so you can ask questions about it in plain language.
- Click the "Ask the run" pill on the Results step. It opens the "Talk to the backtest" dock.
- Ask why a month lost, whether the result looks overfit, or what the drawdown came from.
- Read the answer, which is grounded in your actual run.
Edit, re-run, export, save, share, deploy
The action bar on Results lets you iterate on a run or take it forward.
- Click Edit config to go back to Tune and change coins, dates or params.
- Click Re-run to run again with the current config.
- Click Export to download the run as CSV, Excel (.xlsx) or PDF. The Excel workbook has tabs for Summary, Configuration, Trade log, Leg log, and Daily and Monthly P&L.
- Click Save to save the strategy plus its config to your library, where it can be shared or forked.
- Click Deploy as bot to turn the strategy into a running bot. You can deploy straight from config without running a backtest first.
Run the advanced analyses
Below the main result, an Advanced analysis panel offers three deeper tests. Each runs in the background with its own progress.
- Open Advanced analysis and pick one.
- Walk-forward: checks robustness on rolling out-of-sample windows (periods the strategy was not tuned on), and shows the out-of-sample return per split. It honors your LTP or MARK price source, so you can test both.
- Heatmap: sweeps two parameters across a grid (up to 25 cells) to find a stable region, not a single lucky cell. Click a cell to re-run that combo. Available for ready-made strategies, not custom builds.
- Portfolio: blends two or more strategies on the same universe and shows per-strategy results plus a correlation matrix. Start with two and add more if the correlation is low.
- Run Walk-forward (robustness on out-of-sample windows)
- Run Heatmap (sweep two params for a stable region)
- Run Portfolio (blend strategies, check correlation)
- Read the warning (this is how you spot overfitting)