Use the free tools
Vecktor has three small tools that are free, anonymous, and need no signup. This guide covers the BTC IV rank explainer, the crypto margin calculator, and the funding rate heatmap: what each one shows, how to read it, and what it cannot tell you.
What the free tools are for
Each tool answers one question on its own page. Two are explainers with a sample chart, one is a live calculator. They are starting points, not the full platform.
- Open BTC IV rank to learn where today's option premium sits versus the last year.
- Open the crypto margin calculator to size a futures trade before you place it.
- Open the funding rate heatmap to see whether longs or shorts are crowded.
- Use the cross-links at the bottom of each tool to jump between them.
Read the BTC IV rank chart
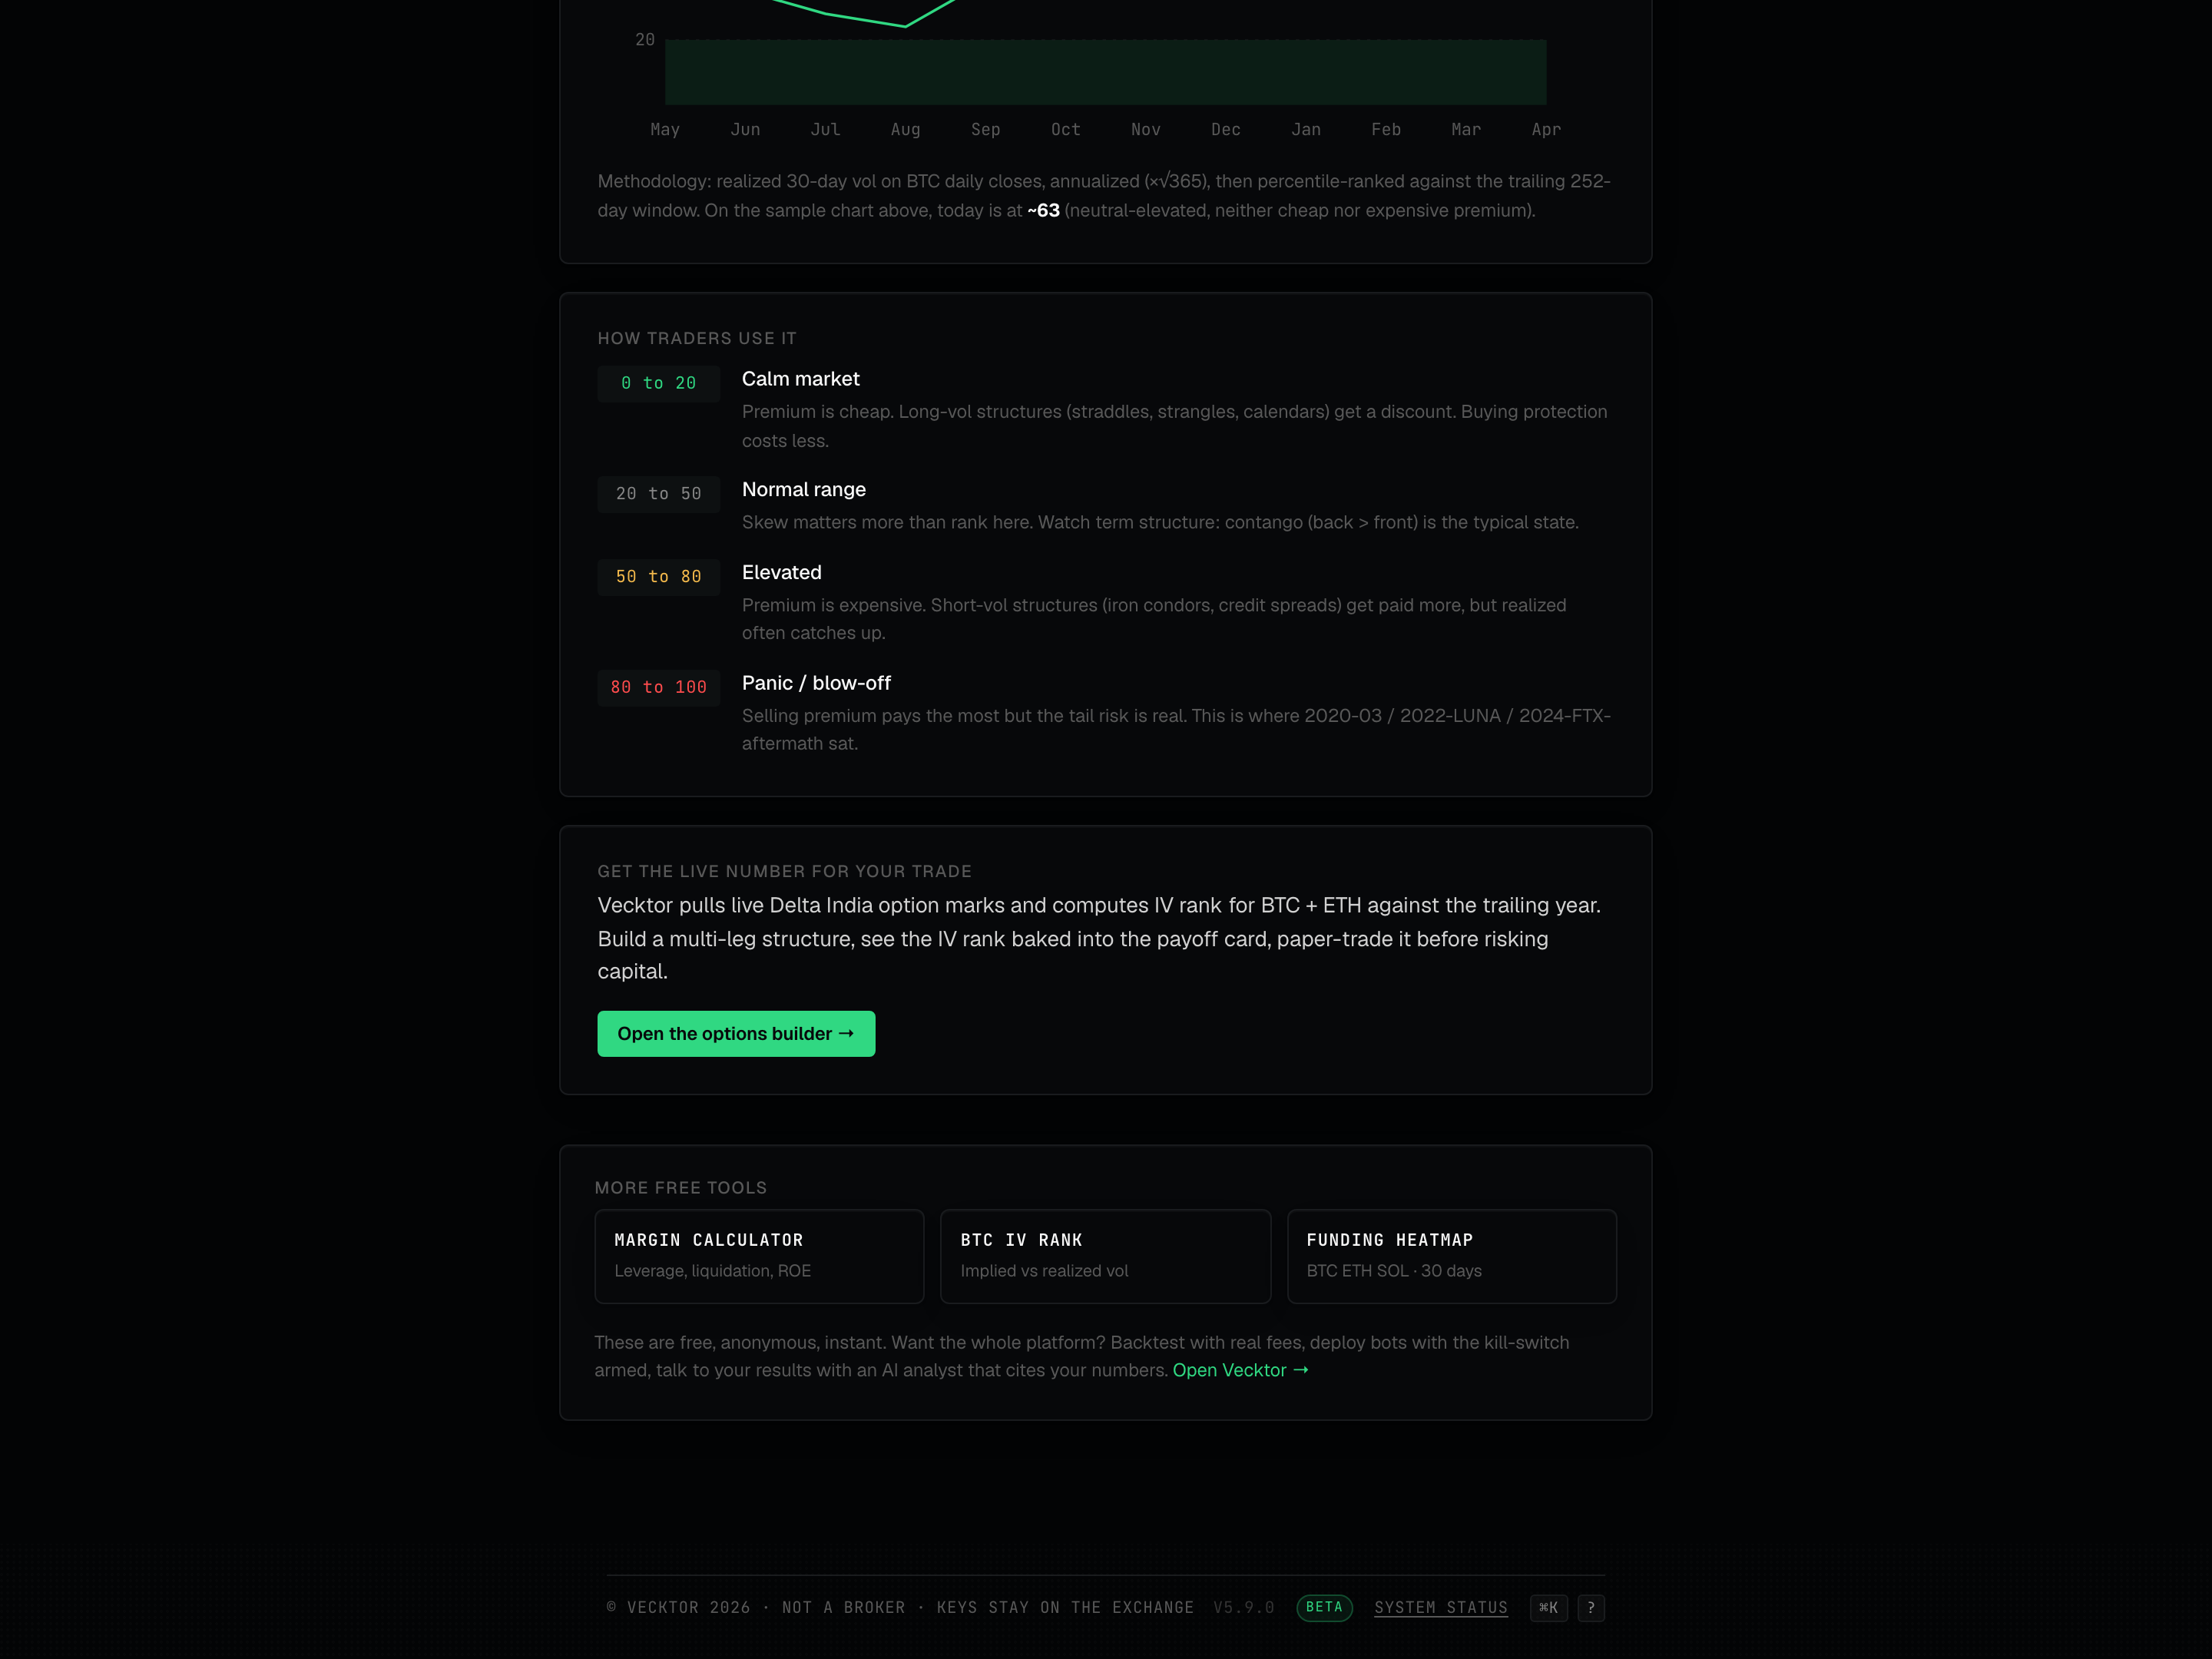
IV is implied volatility (the option market's bet on how much price will move). IV rank places today's IV in the last year's range, from 0 to 100. Below 20 is calm, above 80 is panic.
- Read the line: it plots IV rank month by month over the last 12 months.
- Find the TODAY marker at the right end. On the sample it sits near 63 (neither cheap nor expensive premium).
- Read the colored bands behind the line: a tinted low band, a clear normal band, and a tinted high band.
- Match the band to the How traders use it rows below: 0 to 20 Calm market, 20 to 50 Normal range, 50 to 80 Elevated, 80 to 100 Panic / blow-off.
- Read the 12-month line (IV rank month by month)
- Find the TODAY marker (where premium sits now)
- Low band favours buying vol (premium is cheap)
- High band favours selling (premium is rich, tail risk is real)
Use IV rank to pick a structure
Low rank favours buying volatility (long structures get a discount). High rank favours selling premium (you get paid more), but the tail risk is real.
- In the 0 to 20 Calm market band, consider long-volatility structures like straddles, strangles, or calendars. Premium is cheap.
- In the 20 to 50 Normal range band, let skew and term structure guide you more than rank.
- In the 50 to 80 Elevated band, premium is expensive, so short-vol structures like iron condors or credit spreads get paid more, but realized moves often catch up.
- In the 80 to 100 Panic / blow-off band, selling pays the most but the tail risk is largest. This is where past crash periods sat.
- Click Open the options builder to build the structure, preview its payoff and Greeks, then trade it live - start with a small number of lots.
 1Band by band guidance2Build the structure
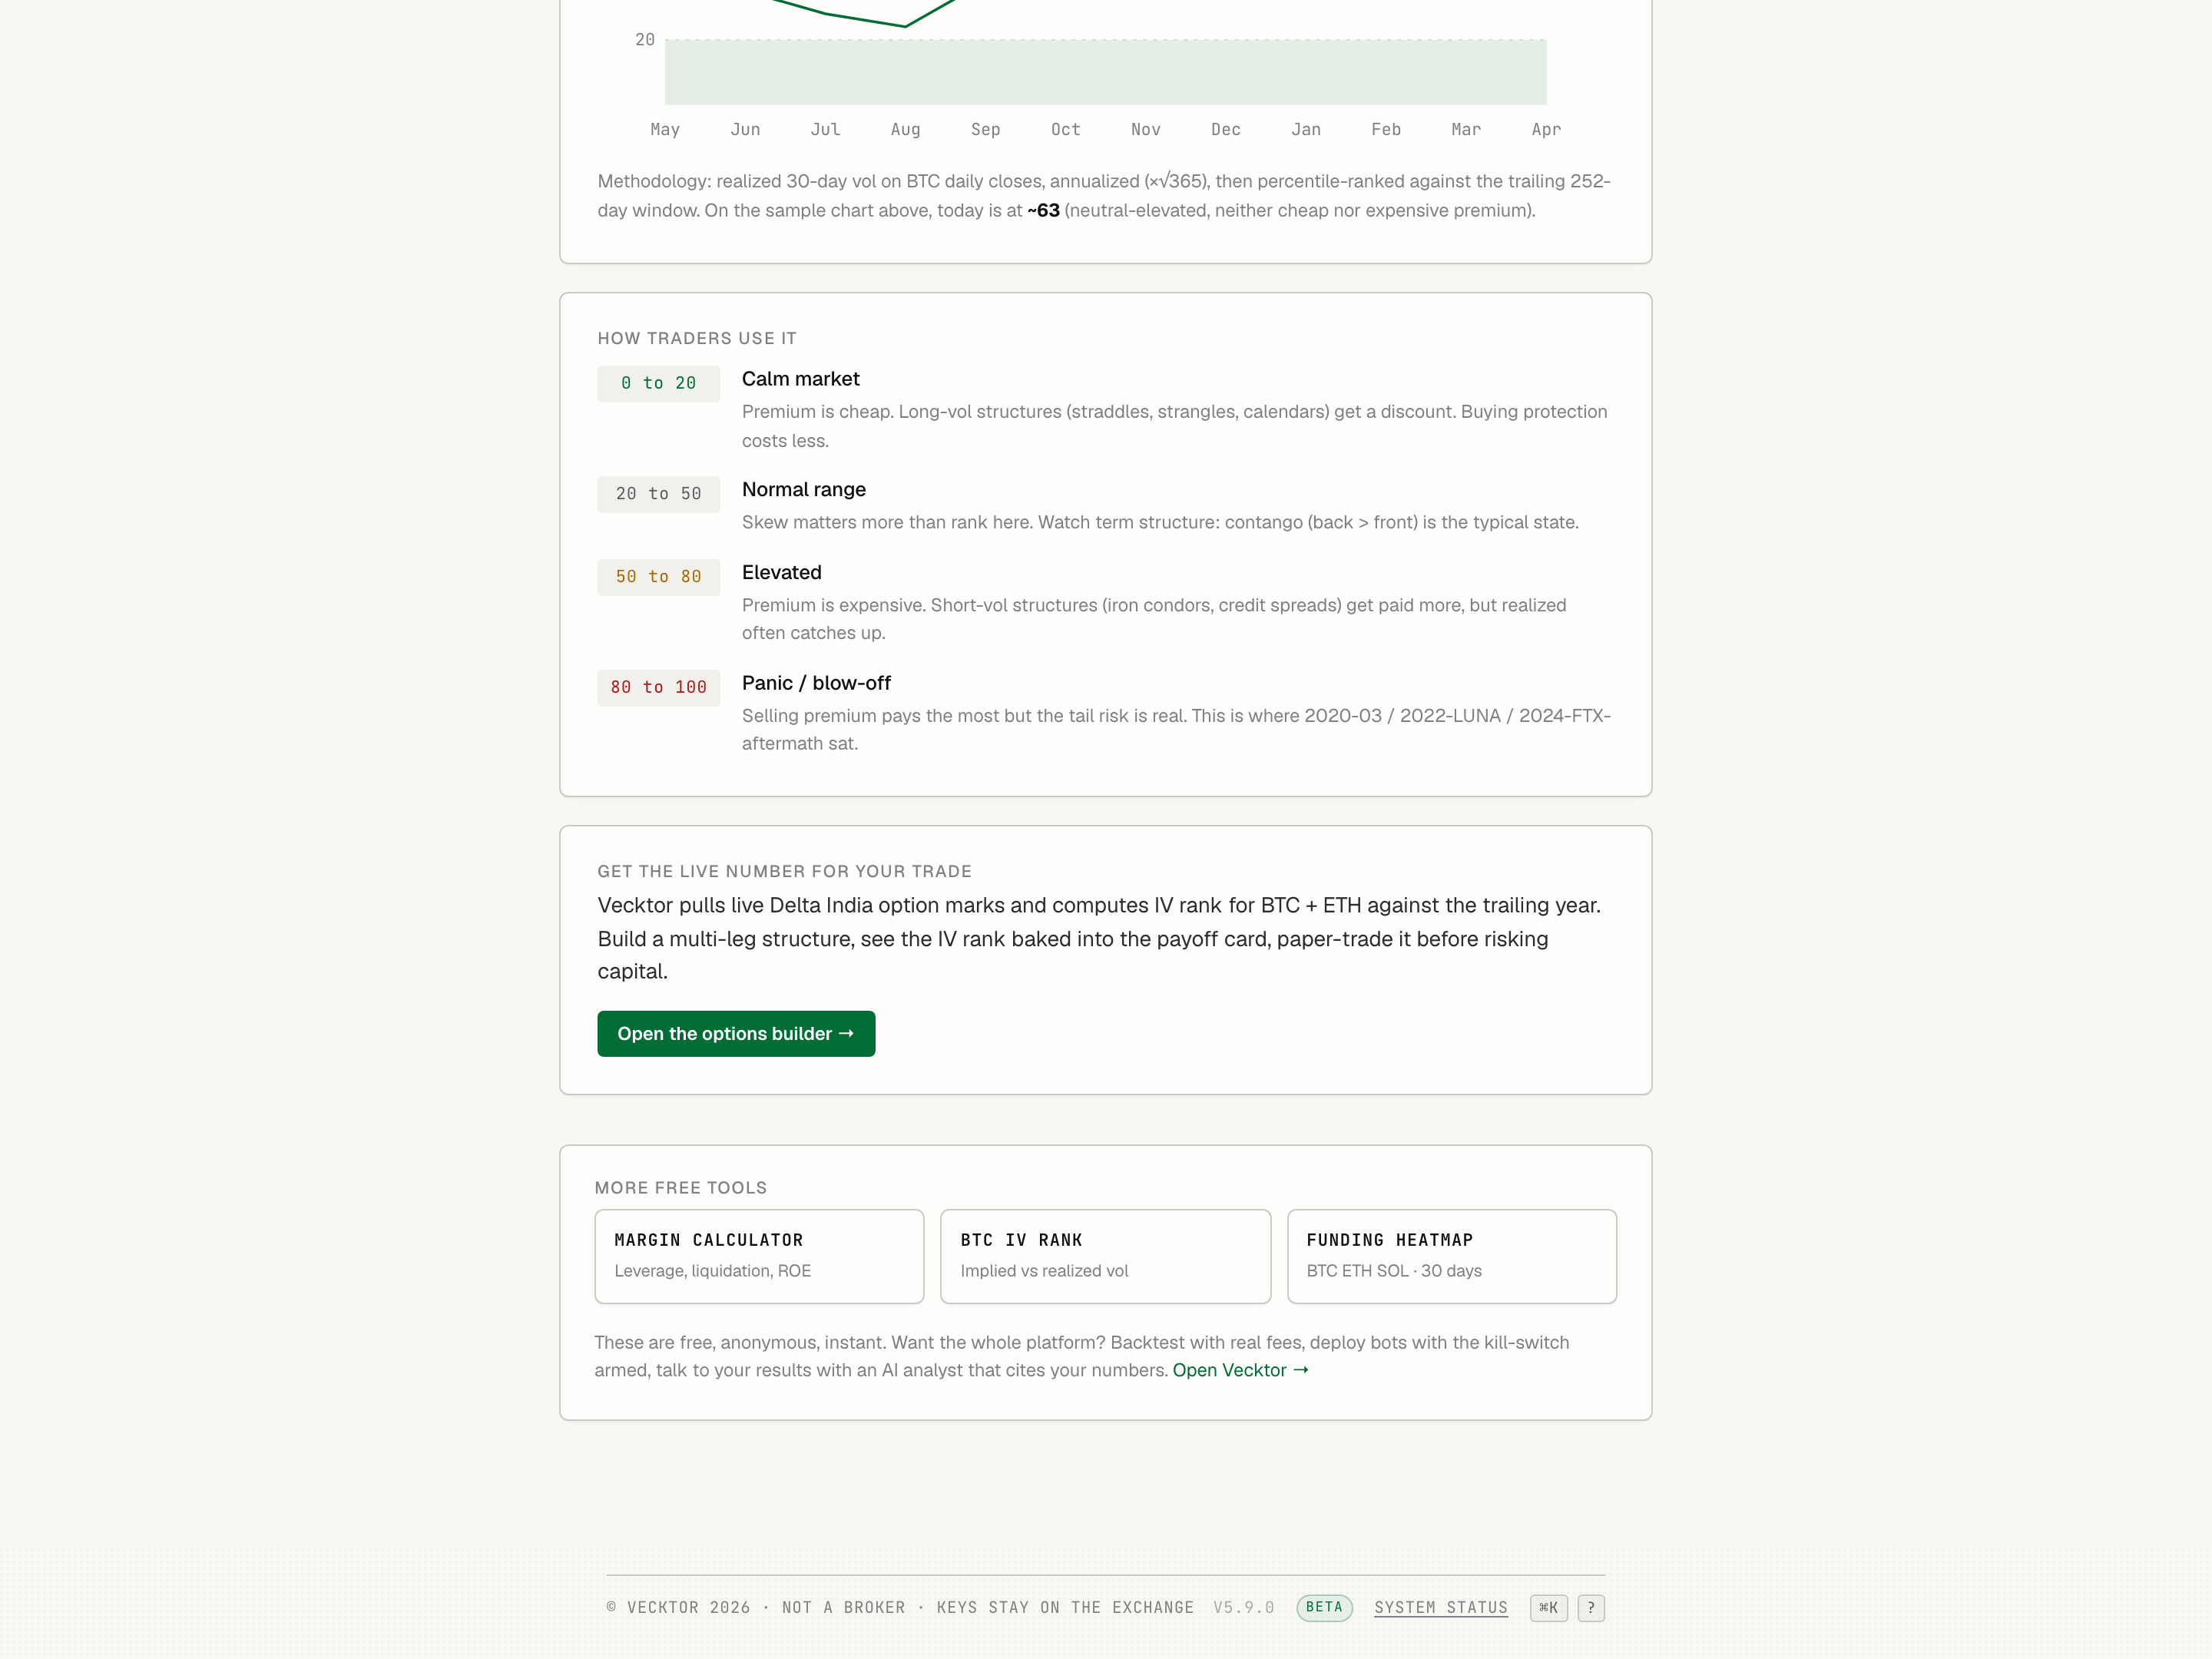
Size a futures trade with the margin calculator
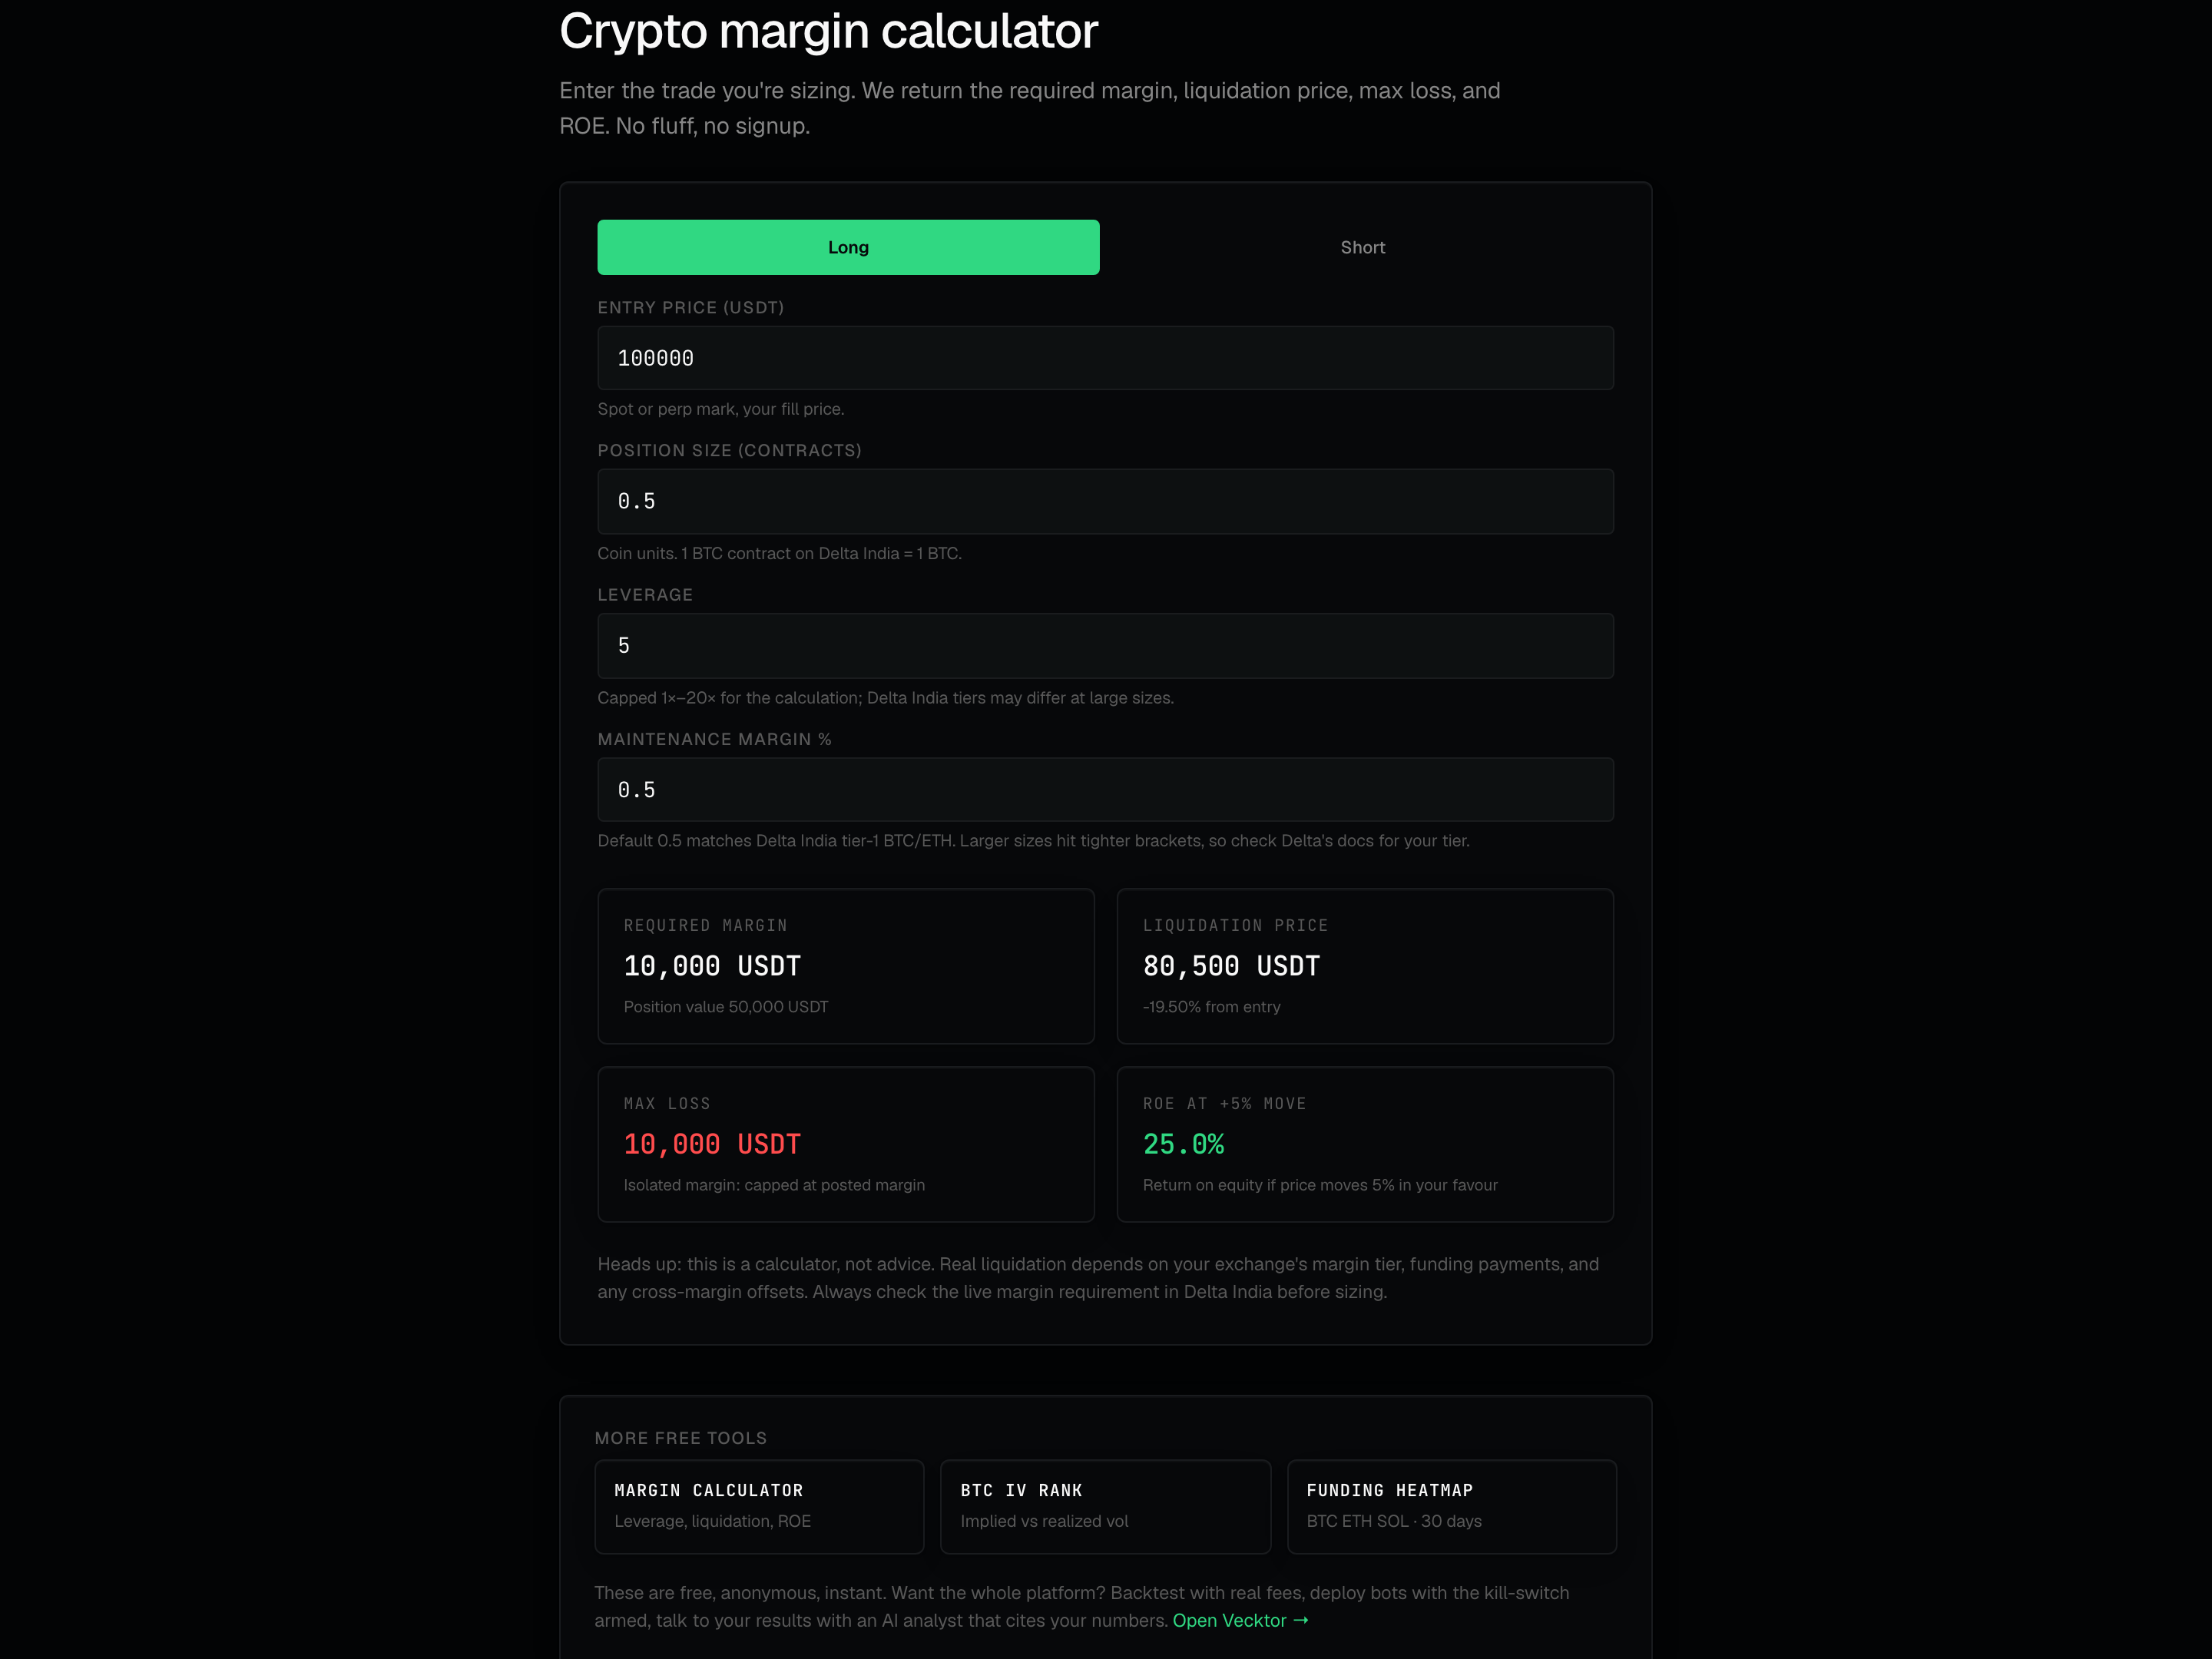
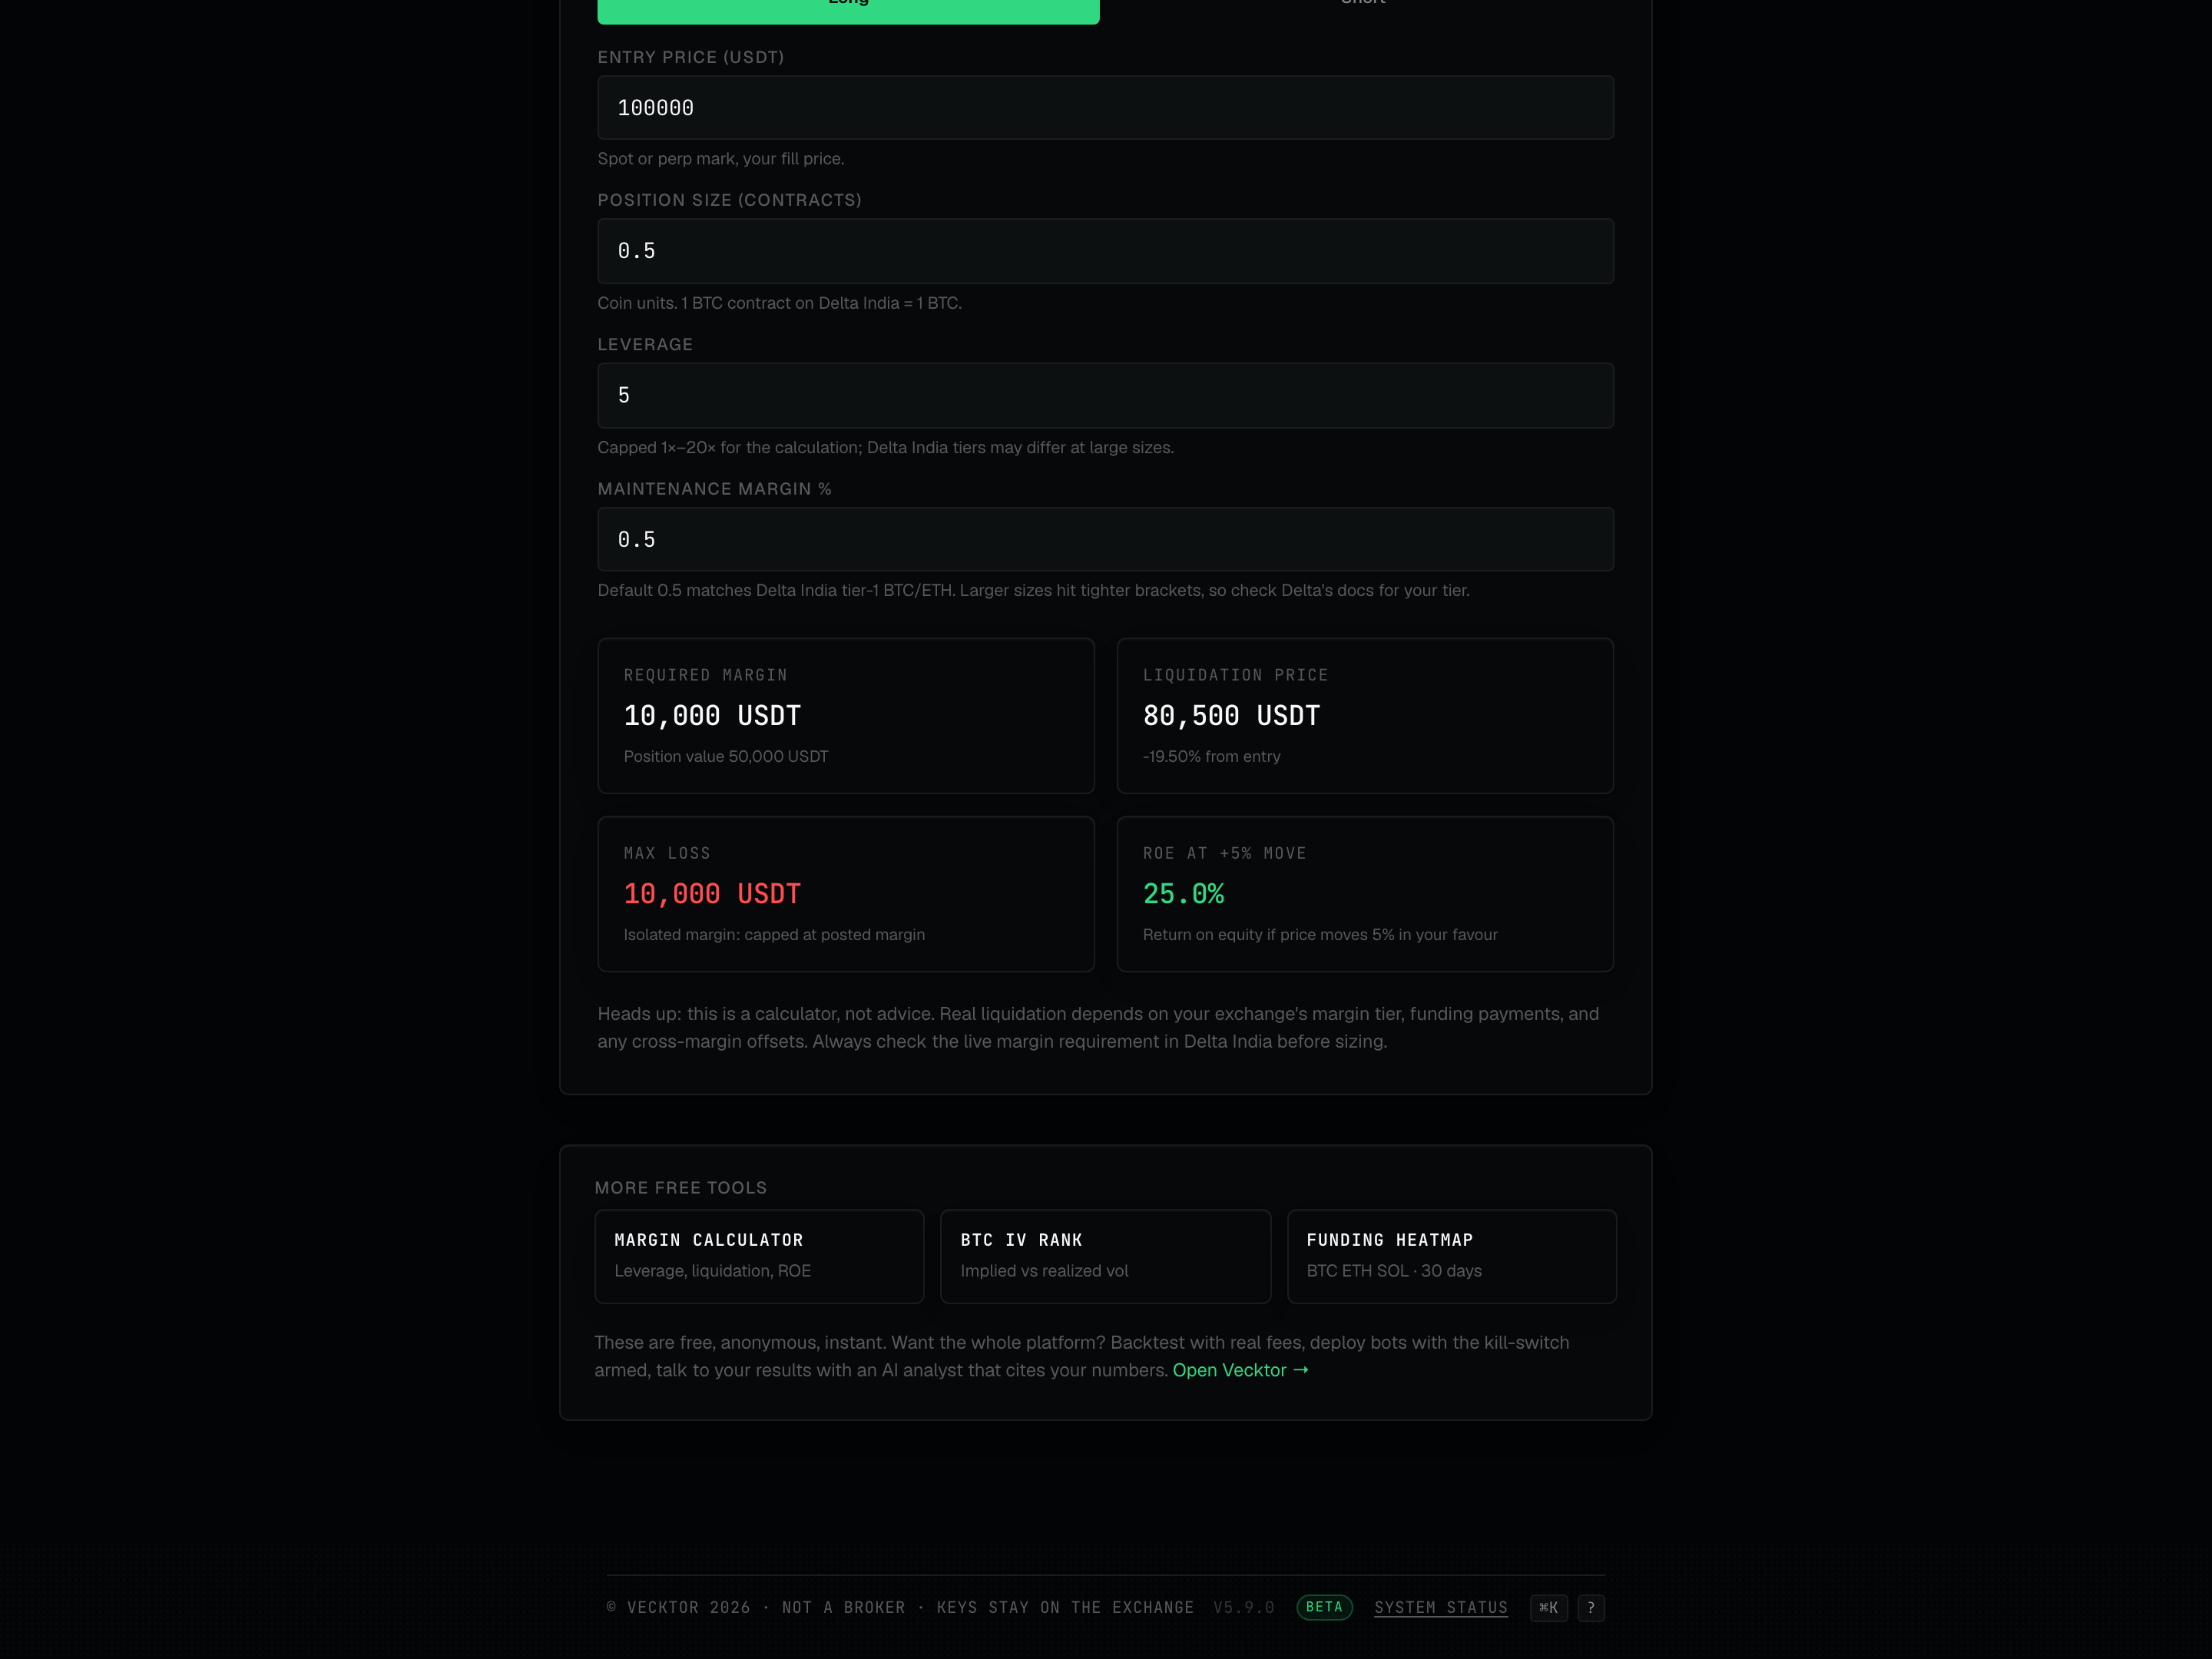
This is a live calculator. Enter the trade you are sizing and it returns the required margin, the liquidation price (where the exchange force-closes you), the max loss, and the ROE (return on equity). No signup.
- Pick Long or Short at the top.
- Set Entry price (USDT): your fill price, spot or perp mark.
- Set Position size (contracts): coin units. One BTC contract on Delta India is one BTC.
- Set Leverage: how many times your margin you are controlling. It is capped 1 to 20 for the math.
- Leave Maintenance margin % at 0.5, or change it. 0.5 matches the tier-1 BTC and ETH bracket.
- Read the four result cards below as they update live.
 1Long or Short2Your fill price3Capped 1 to 20
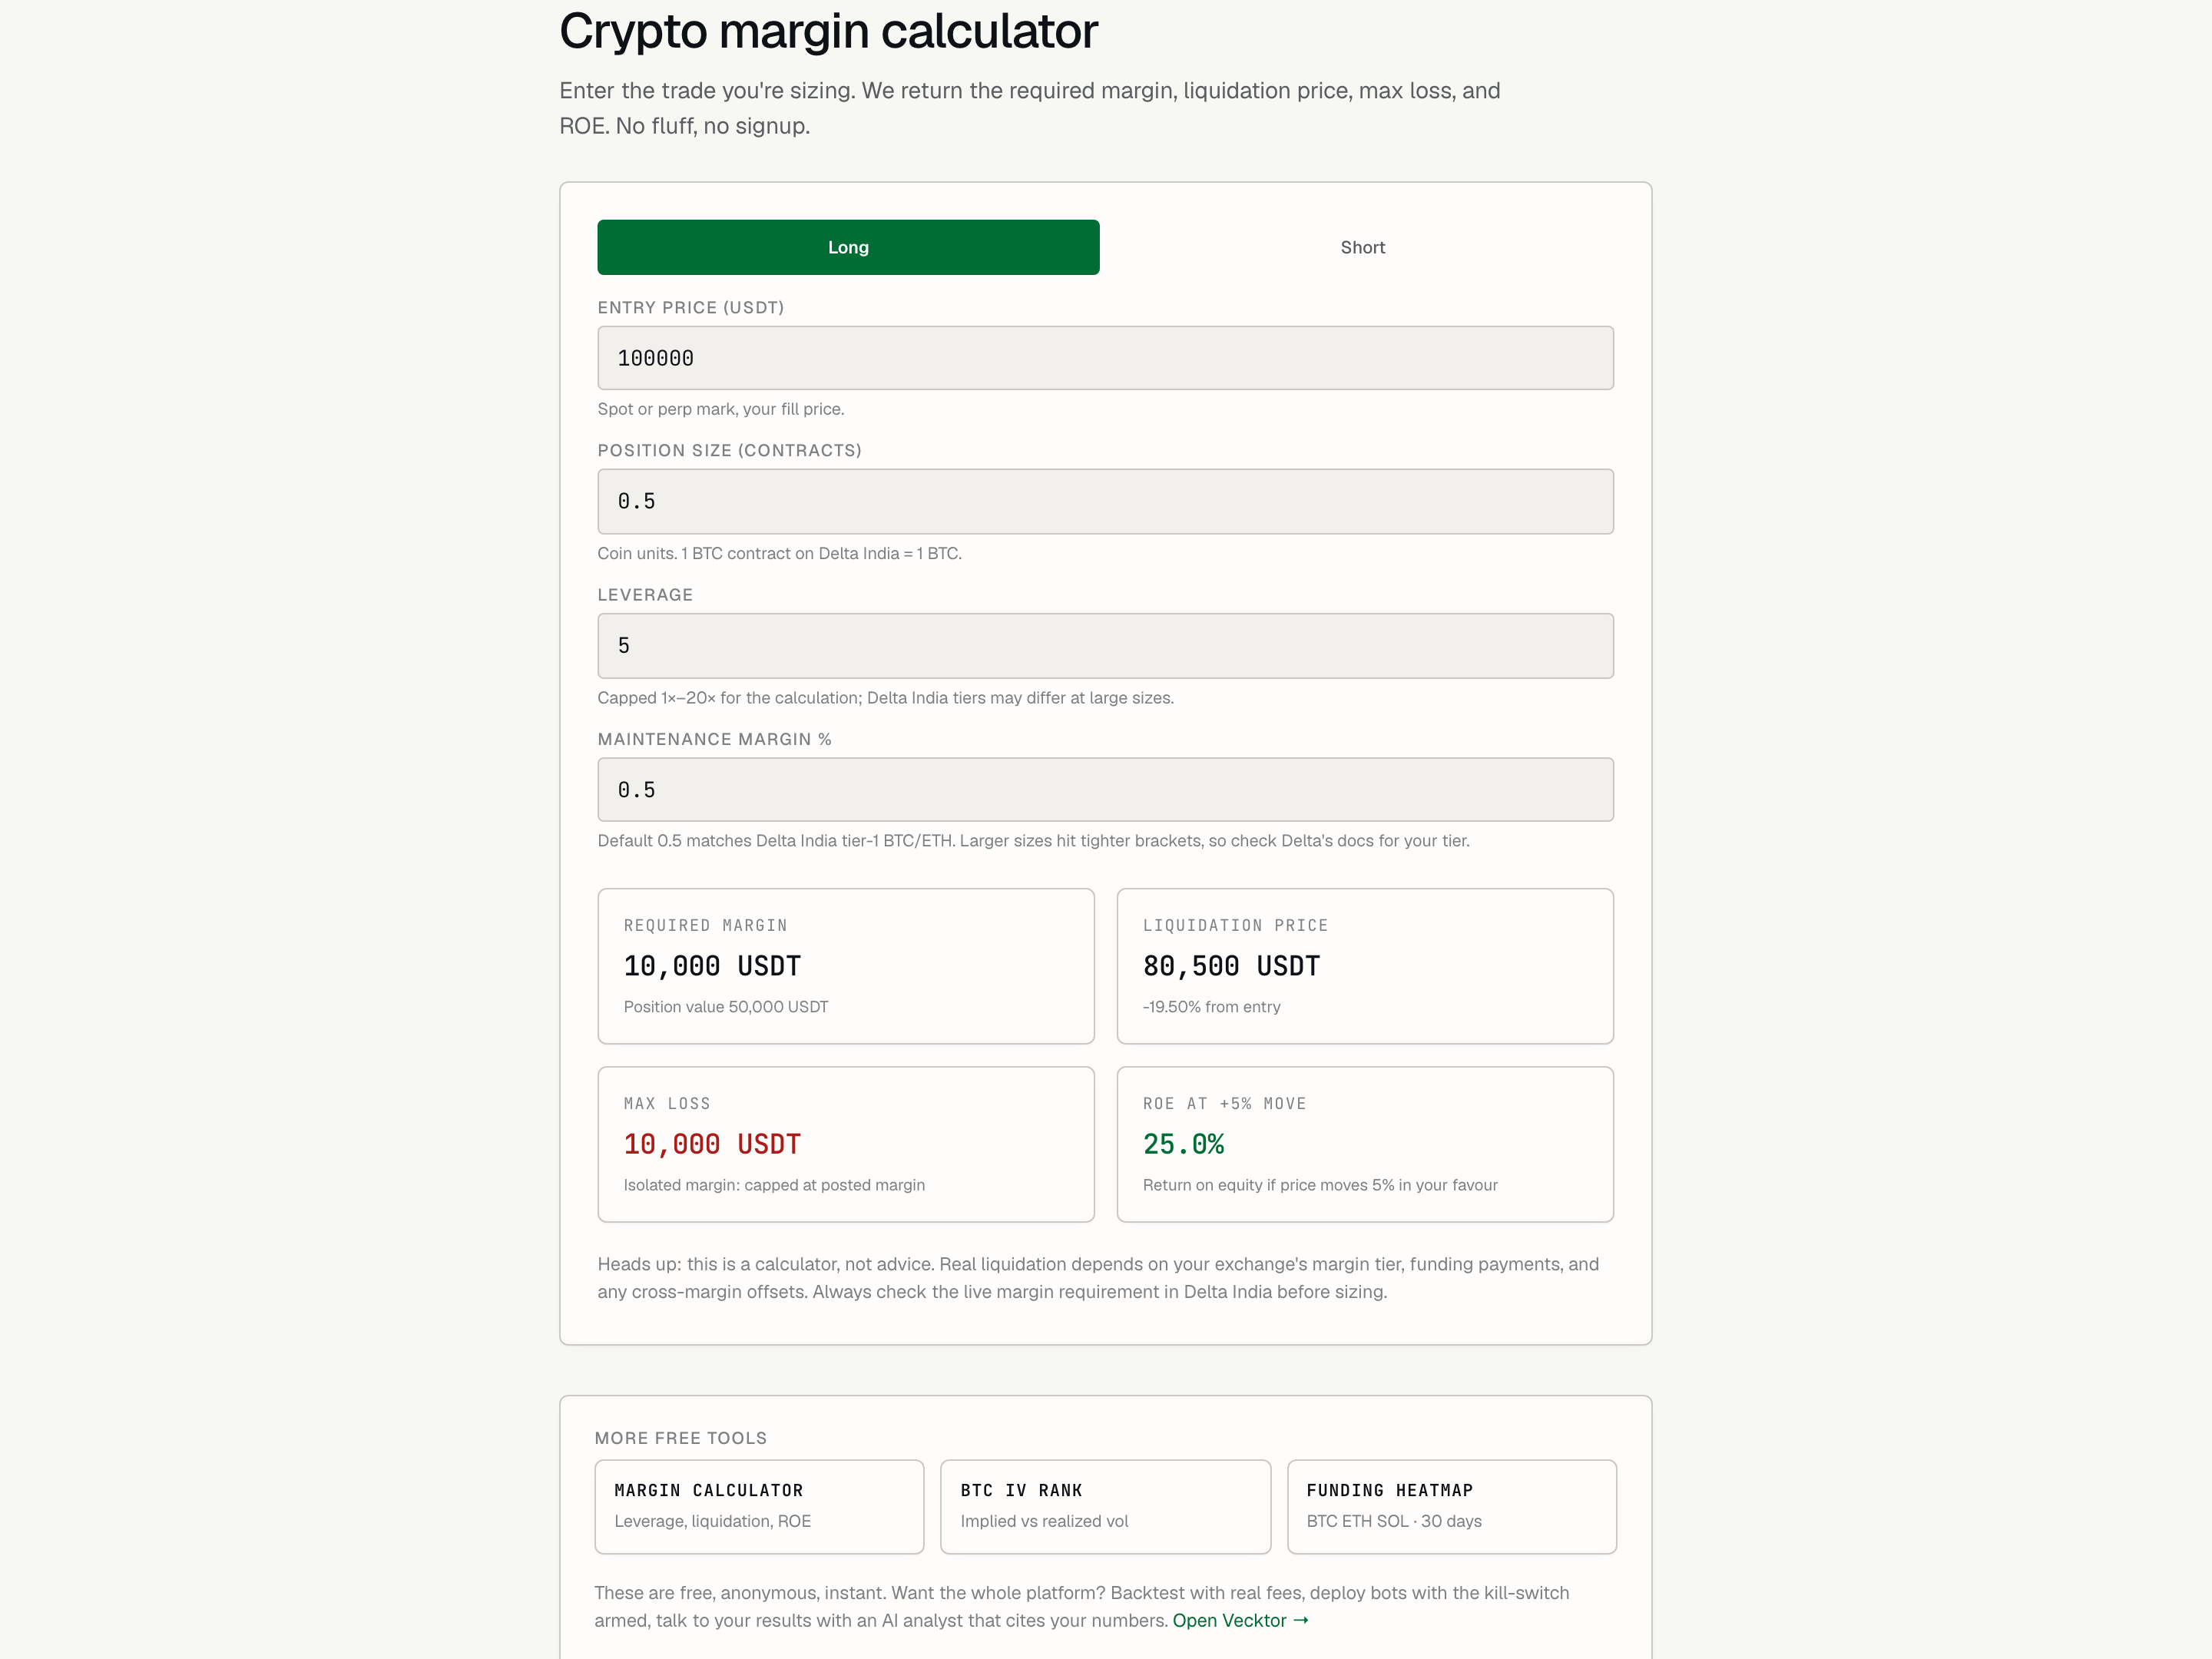
- Pick Long or Short
- Set the entry price (your fill price in USDT)
- Set the size in contracts (1 BTC contract = 1 BTC)
- Set the leverage (capped 1 to 20 here)
- Leave maintenance margin at 0.5 (tier-1 BTC/ETH default)
Read the margin result cards
Four cards update as you type. Each answers a different sizing question.
- Read Required margin: the capital you must post for the position. Its small print shows the full position value.
- Read Liquidation price: where the position gets force-closed, with the percent distance from your entry. It turns amber when that distance is under 5 percent (tight).
- Read Max loss: with isolated margin (each position risks only its own posted margin), this is capped at the margin you posted.
- Read ROE at +5% move: your return on equity if price moves 5 percent your way. Leverage is why this is larger than 5 percent.
 1Capital to post2Force-close level3Return on equity
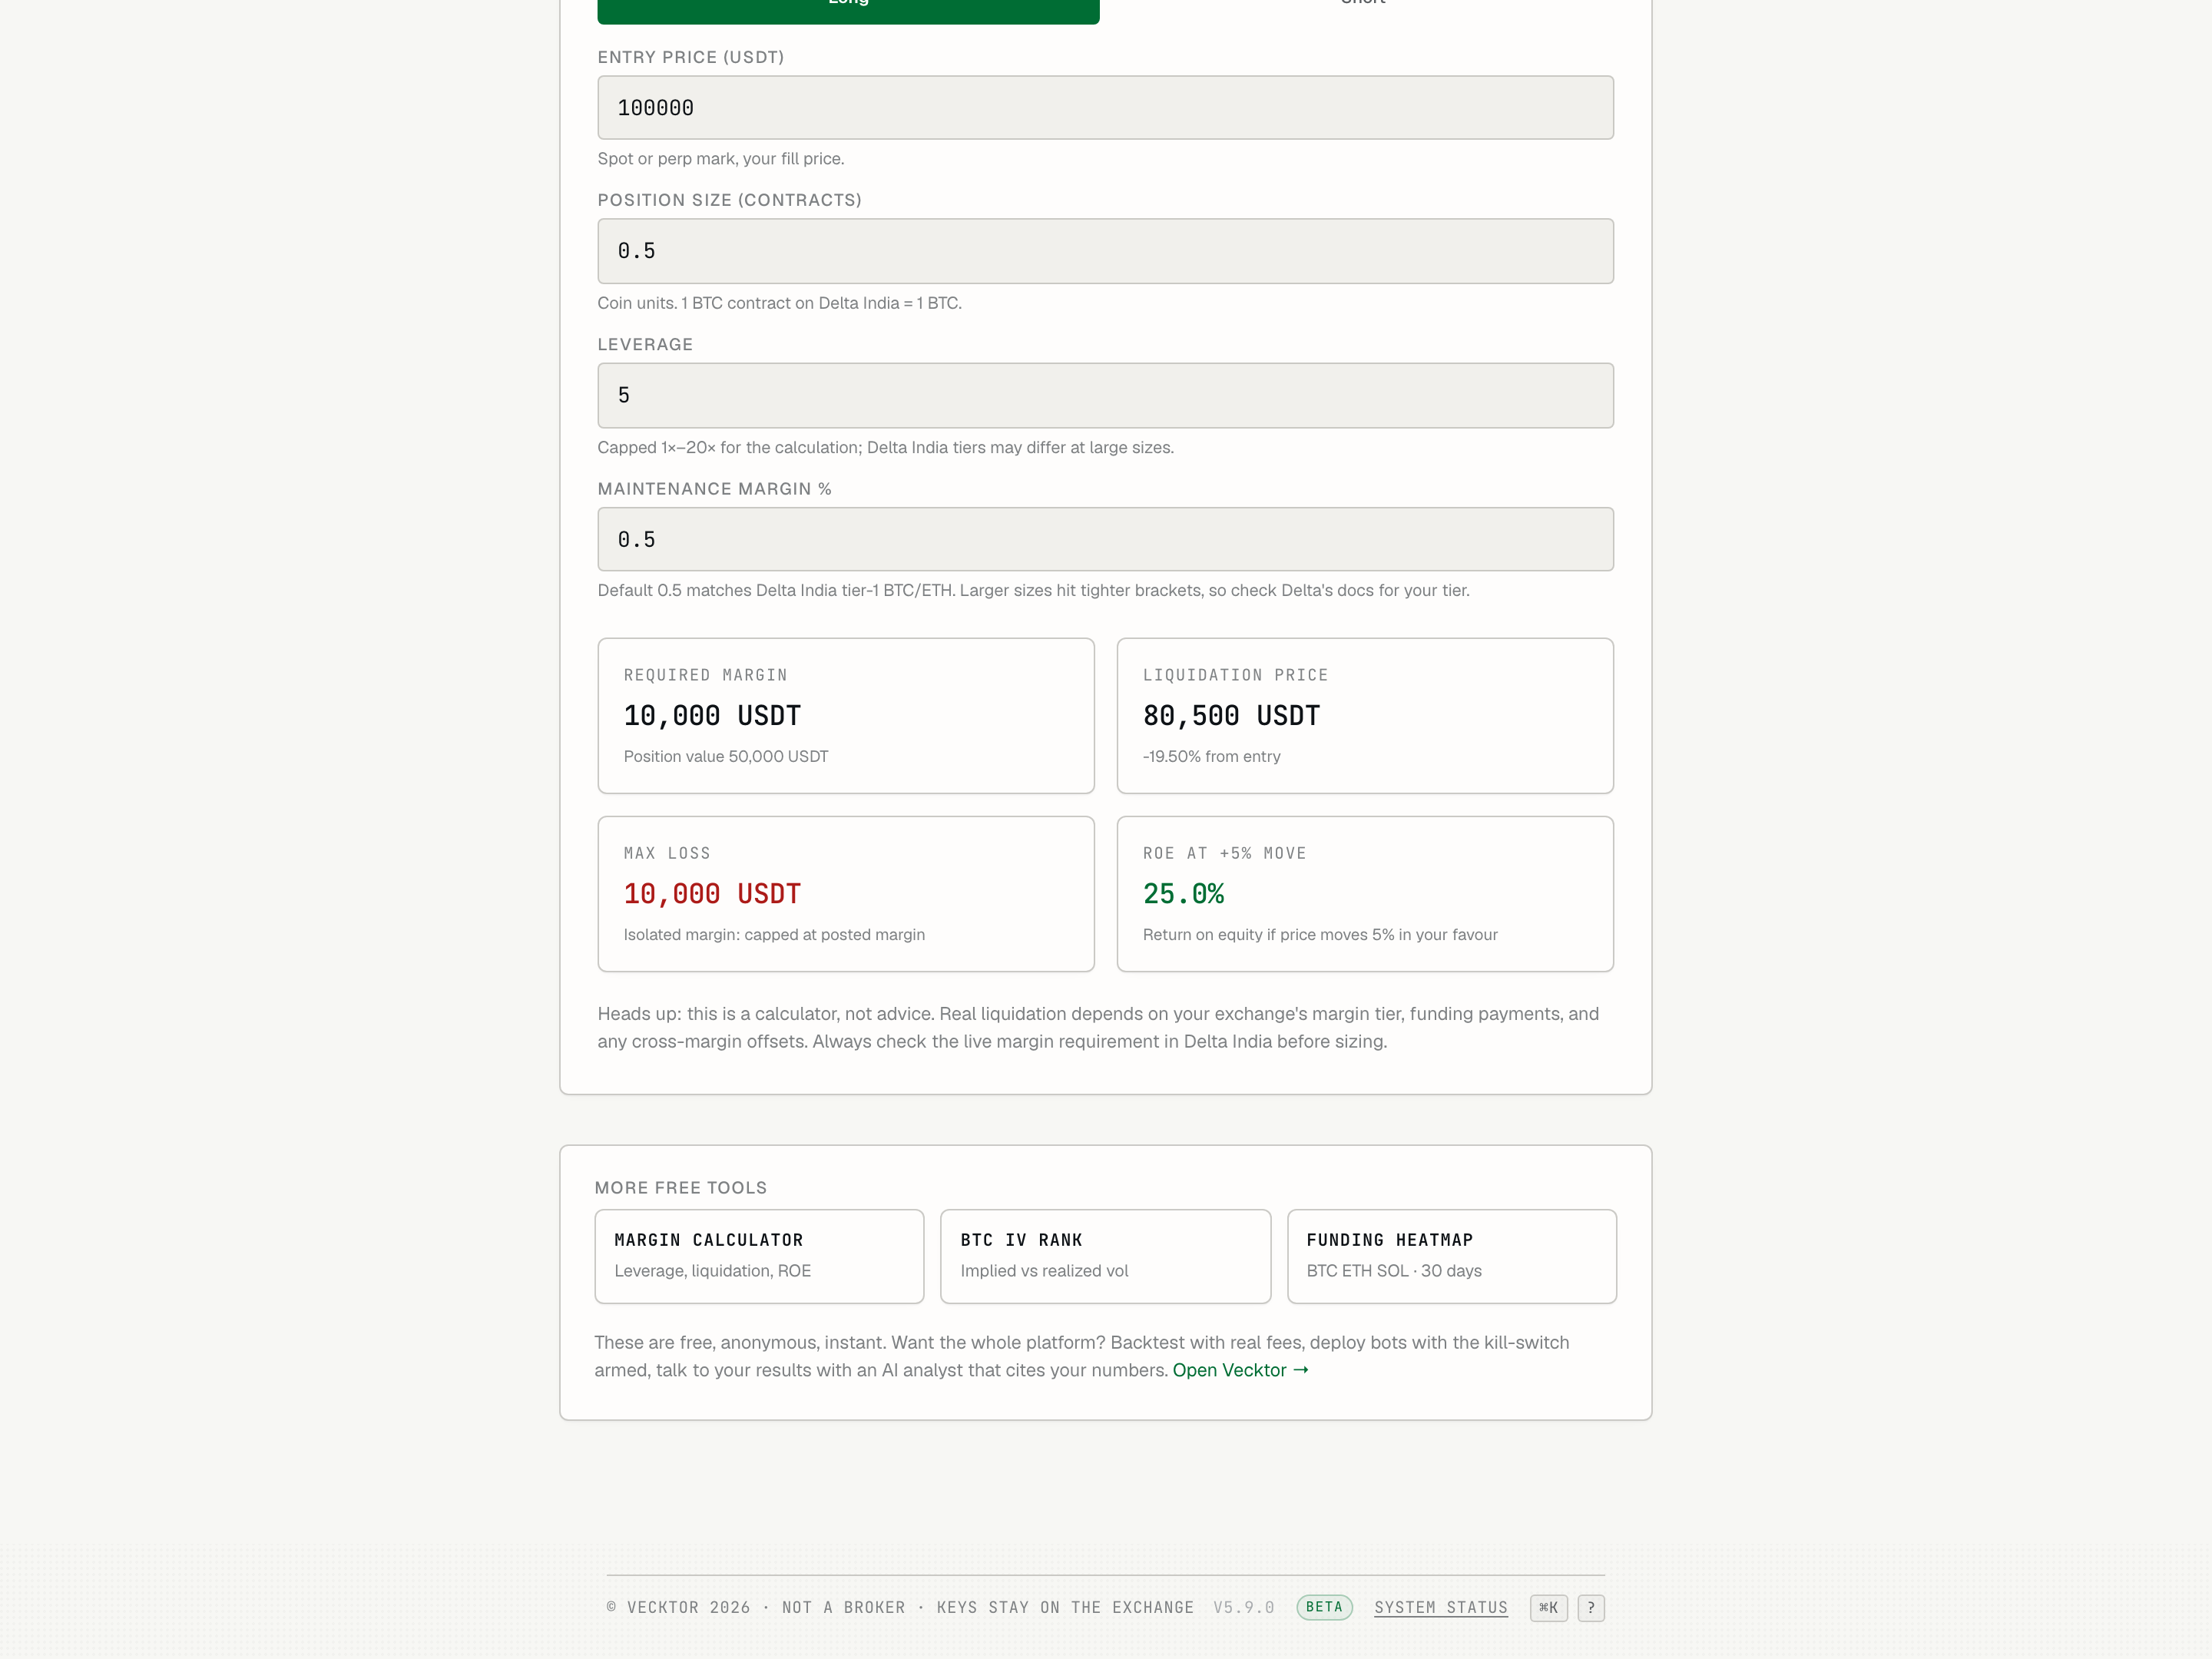
- Read required margin (capital you must post)
- Check liquidation price (amber if under 5% away)
- Read max loss (isolated: capped at posted margin)
- Read ROE (return if price moves 5% your way)
What the margin calculator cannot know
It is a calculator, not advice, and not a live tie to your account. Treat the numbers as a clean estimate of the simple case.
- Know that it assumes isolated margin. Cross-margin (positions sharing one balance) changes the liquidation math.
- Know that it does not include funding payments, which move your liquidation point over time.
- Know that it uses one maintenance margin percent. The exchange steps to tighter brackets at larger sizes.
- Treat the result as a sizing estimate, then confirm the live margin requirement on the exchange before you place the trade.
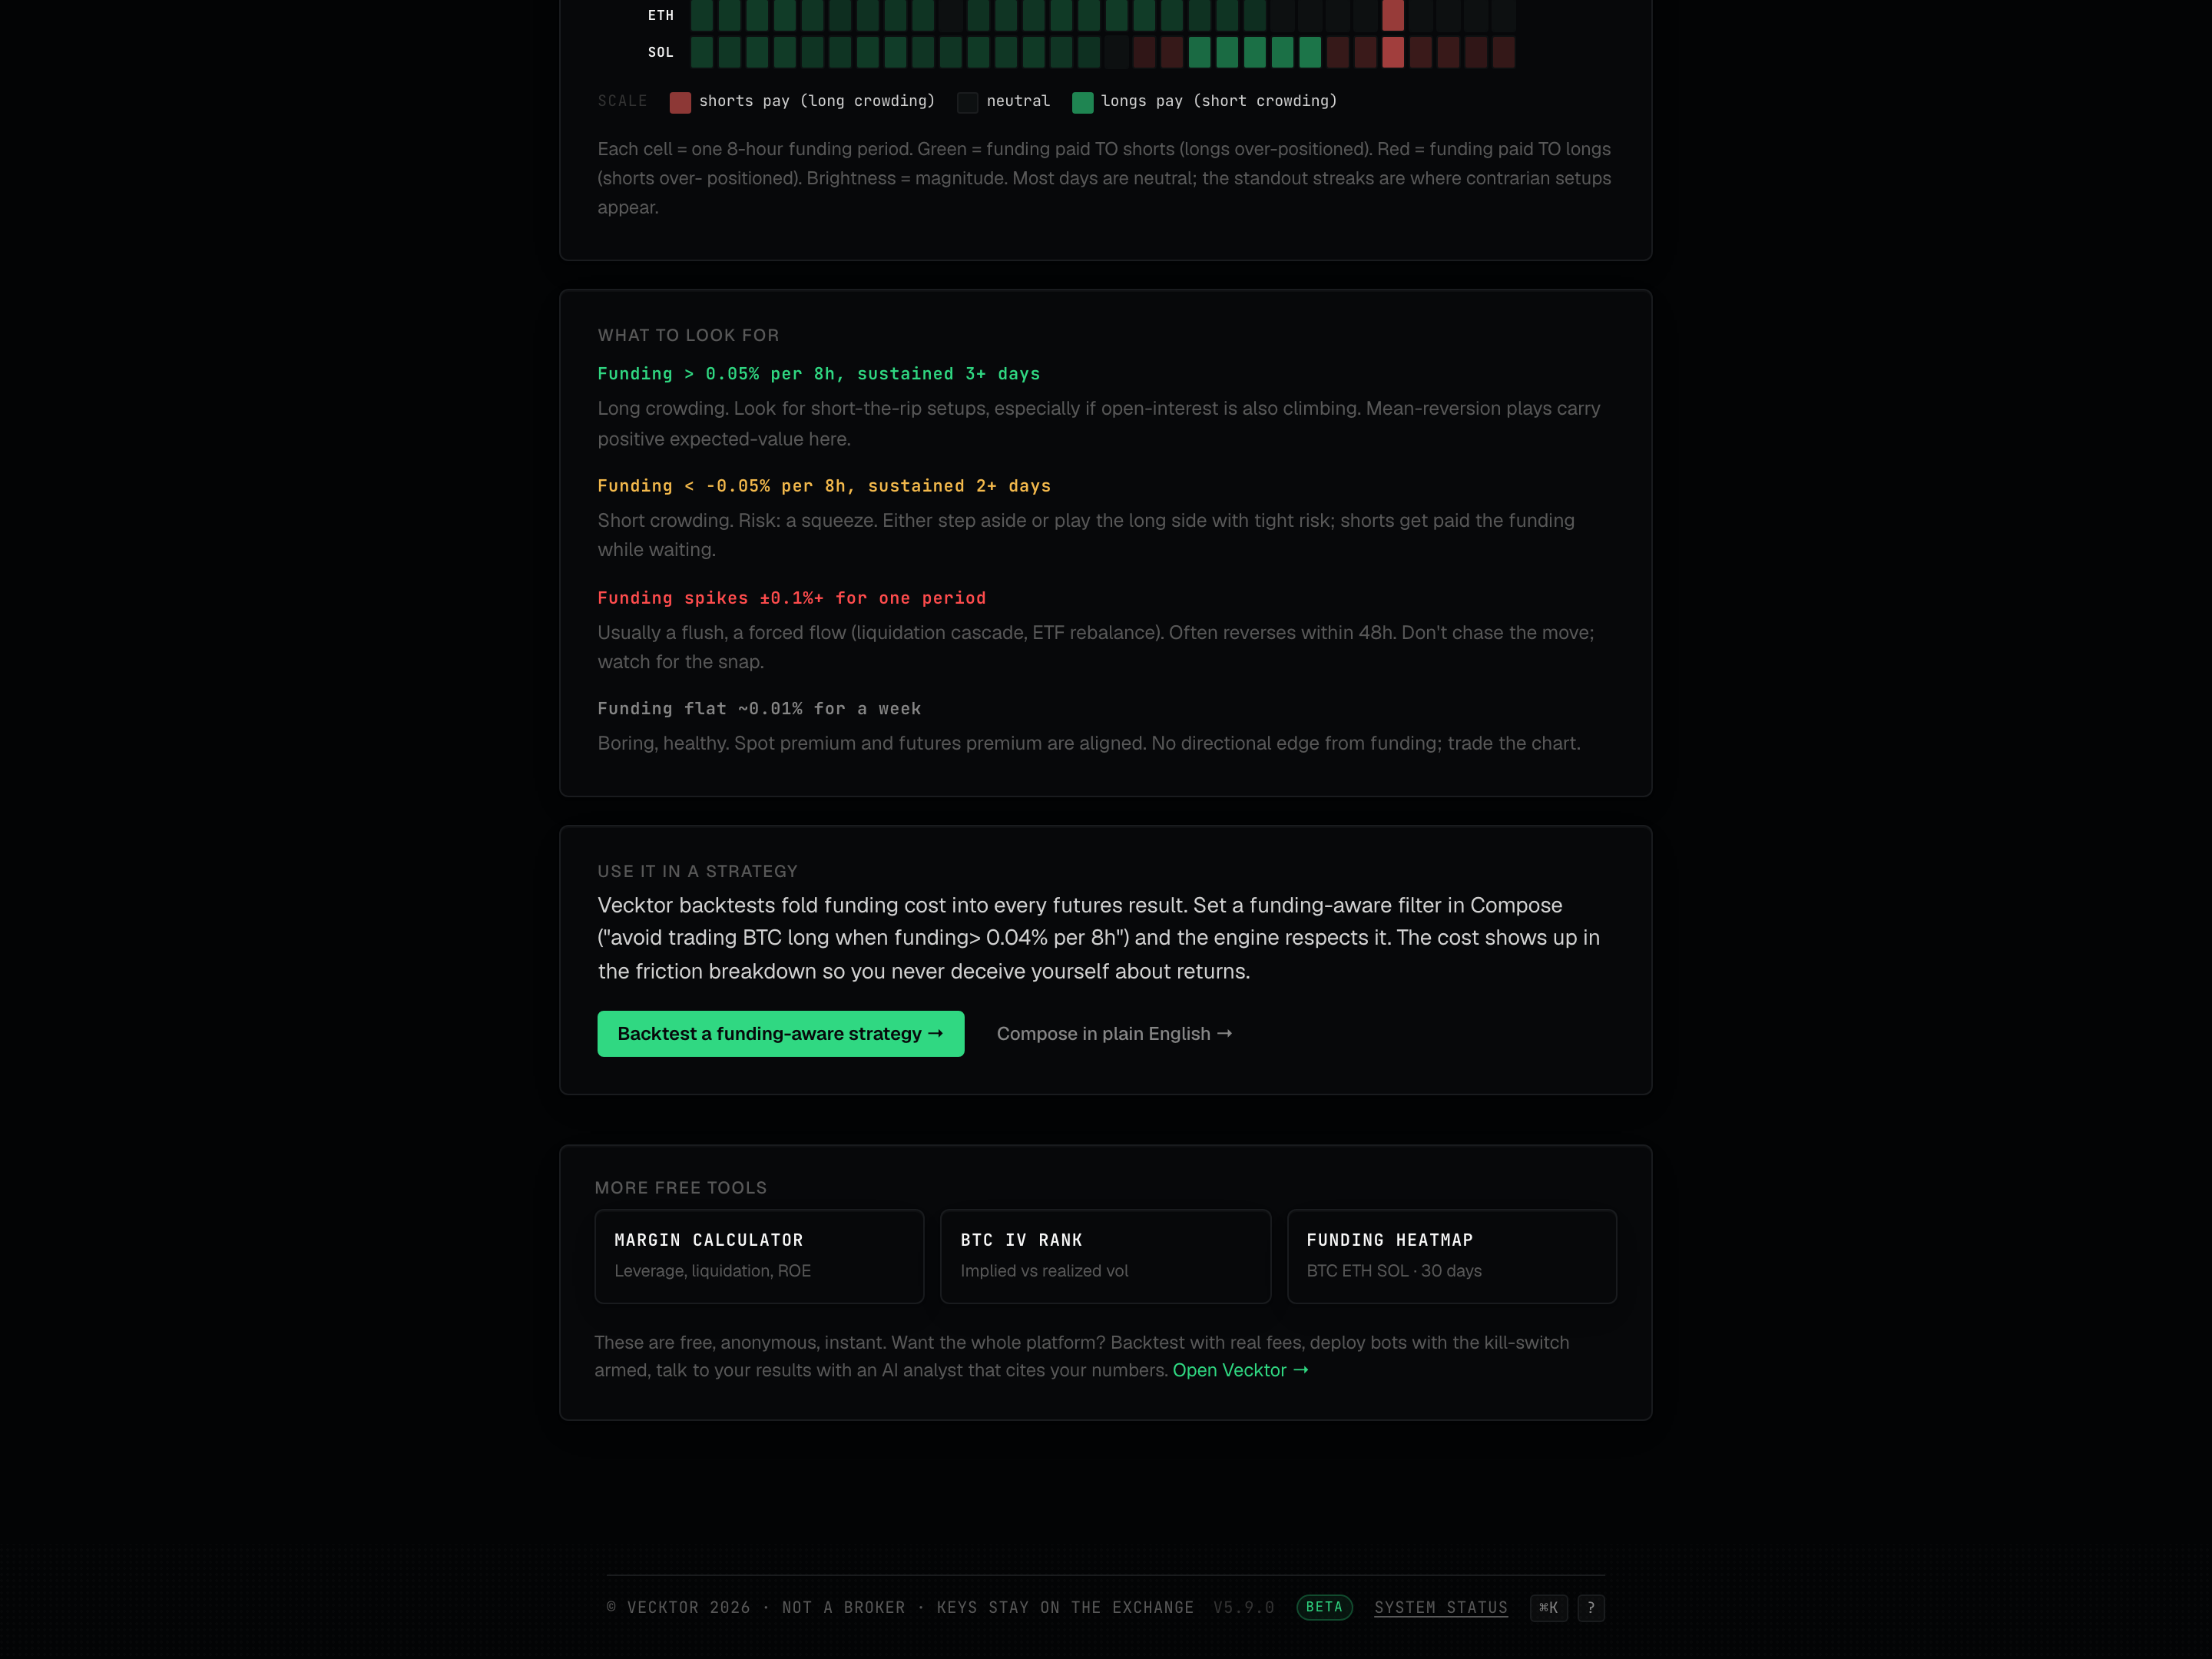
Read the funding rate heatmap
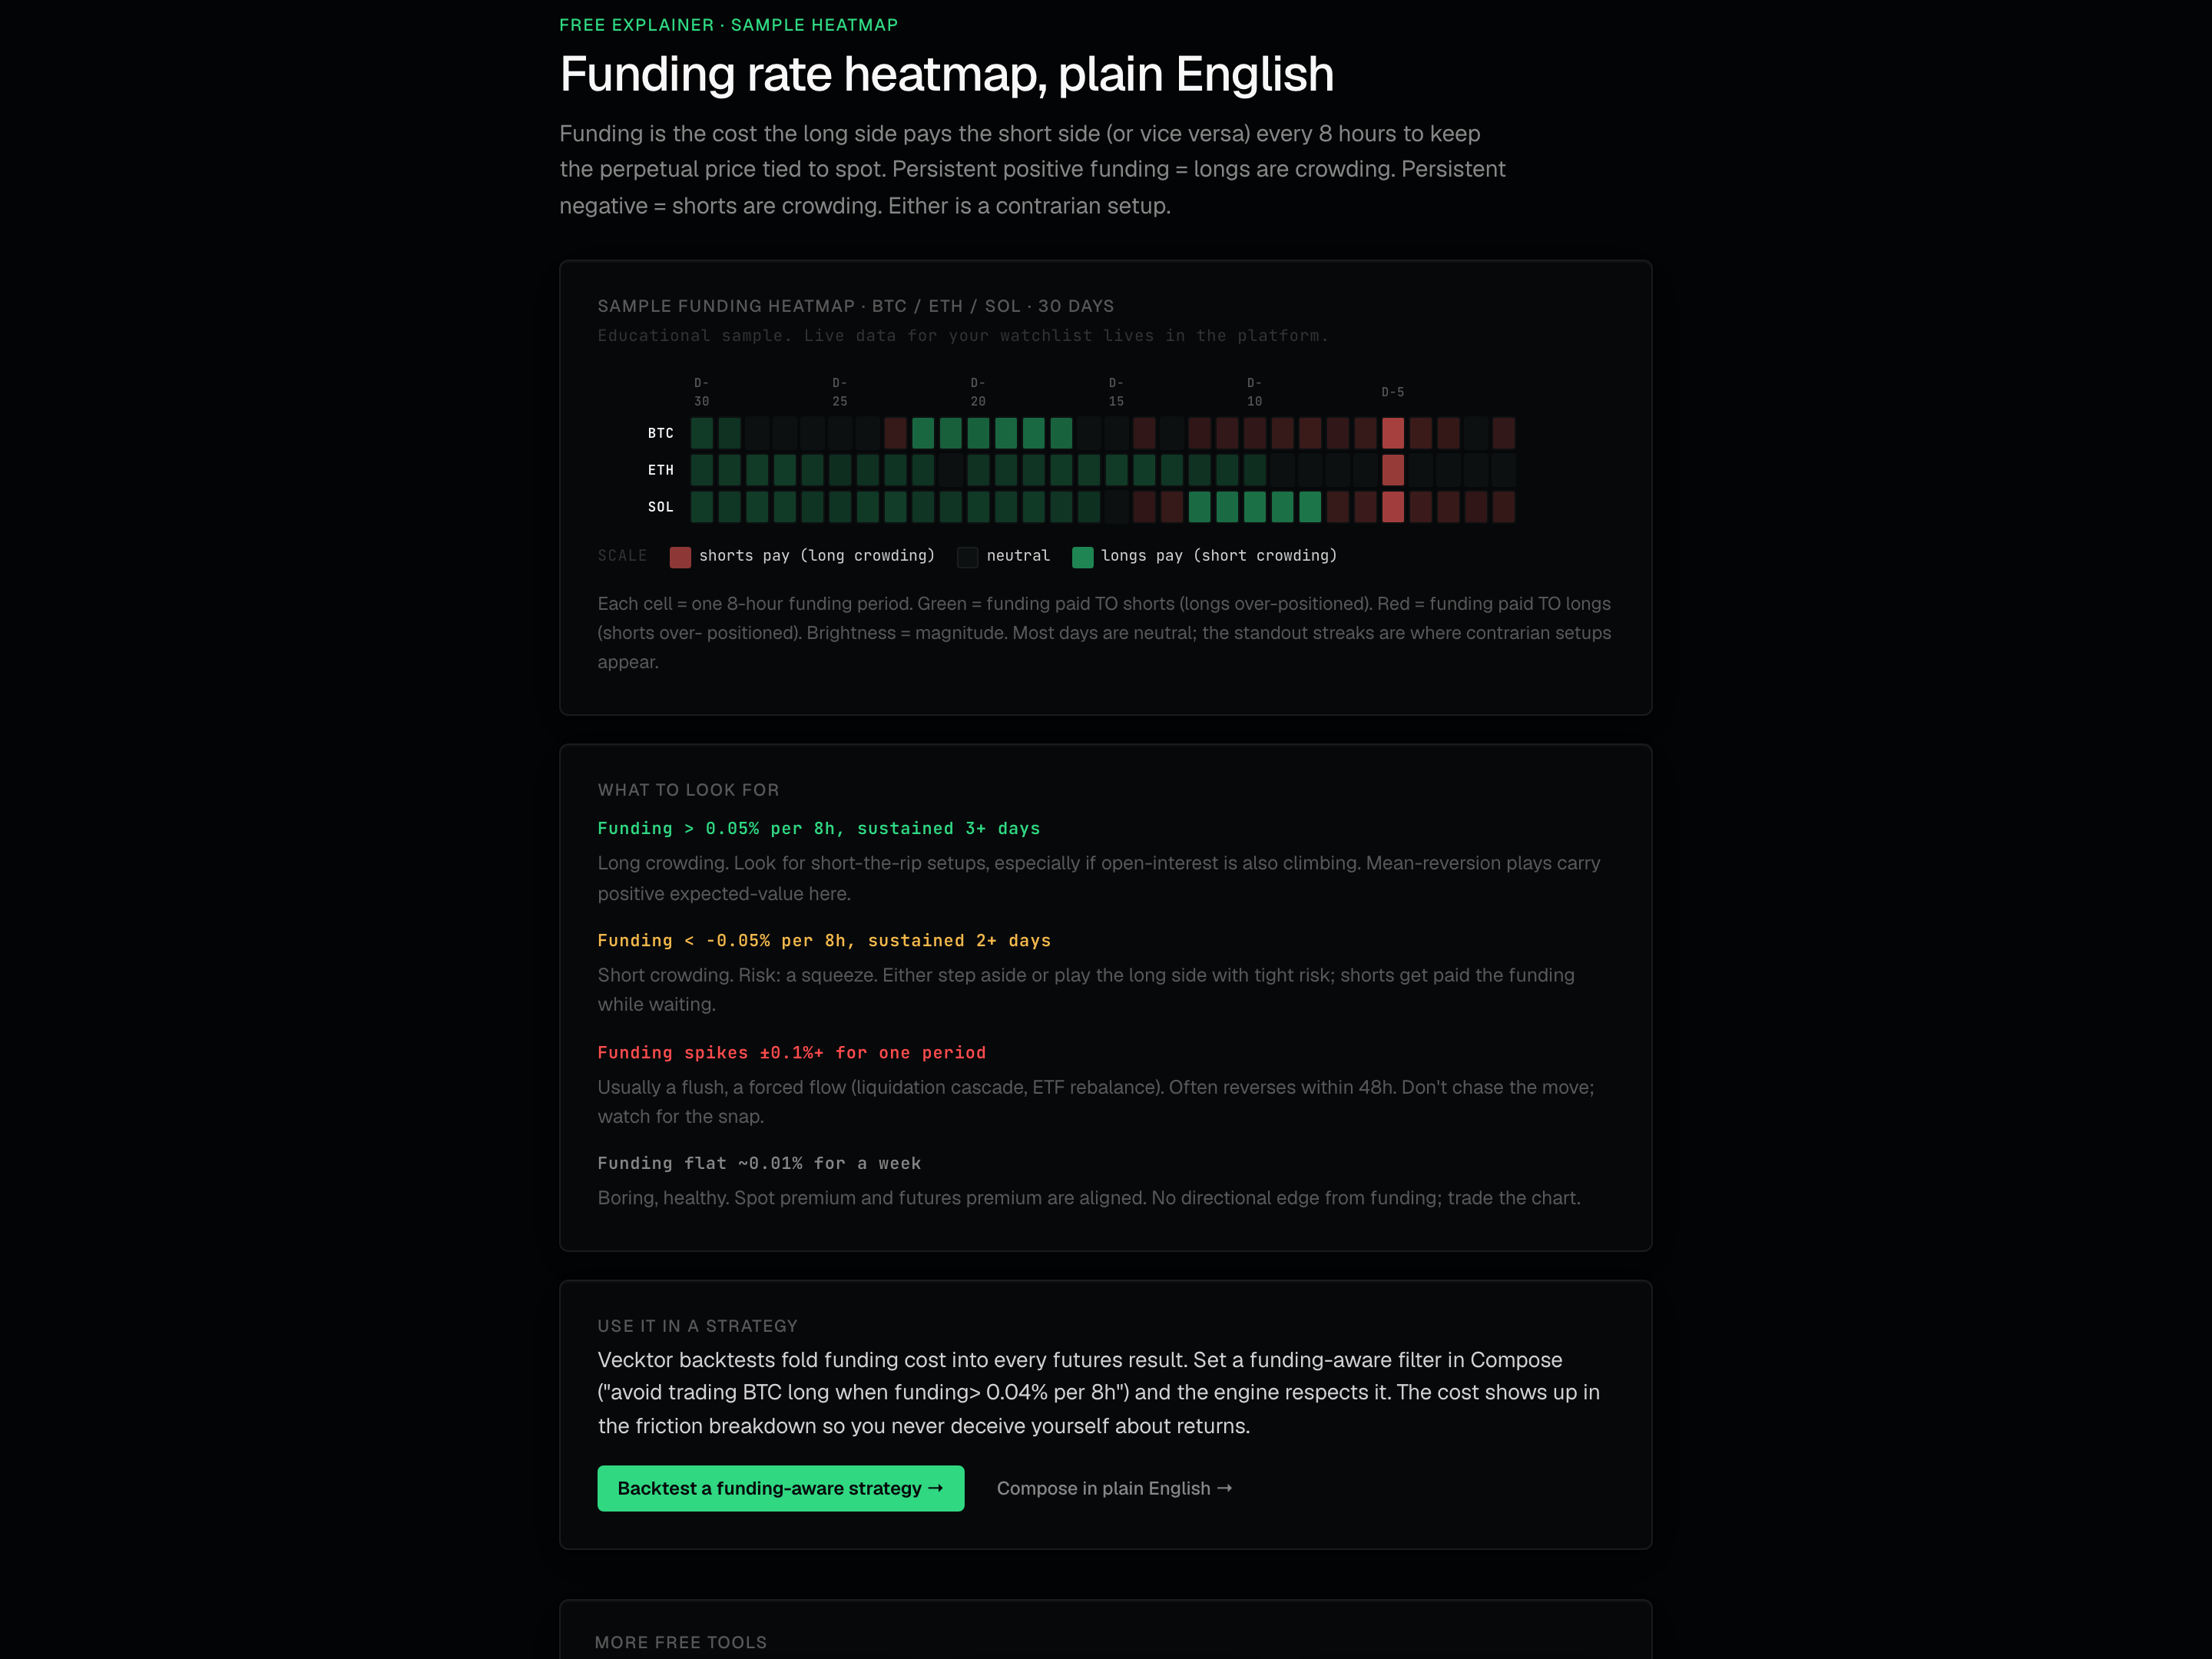
Funding is the fee the long side pays the short side (or the reverse) every 8 hours to keep the perpetual price tied to spot. The grid is 3 instruments down (BTC, ETH, SOL) by 30 days across. Each cell is one day's average 8-hour rate.
- Read the rows: BTC, ETH, and SOL, one per row.
- Read across each row left to right: oldest day on the left, most recent on the right, with a label every 5 days (D-30, D-25, down to D-5).
- Read the color of a cell: green means shorts pay (long crowding), red means longs pay (short crowding), faint grey is neutral.
- Read the brightness: brighter is a bigger rate. Hover a cell to see the exact value in basis points (1 bp = 0.01 percent).
- Check the SCALE legend below the grid to confirm which color is which.
 1BTC / ETH / SOL by 30 days2Color legend
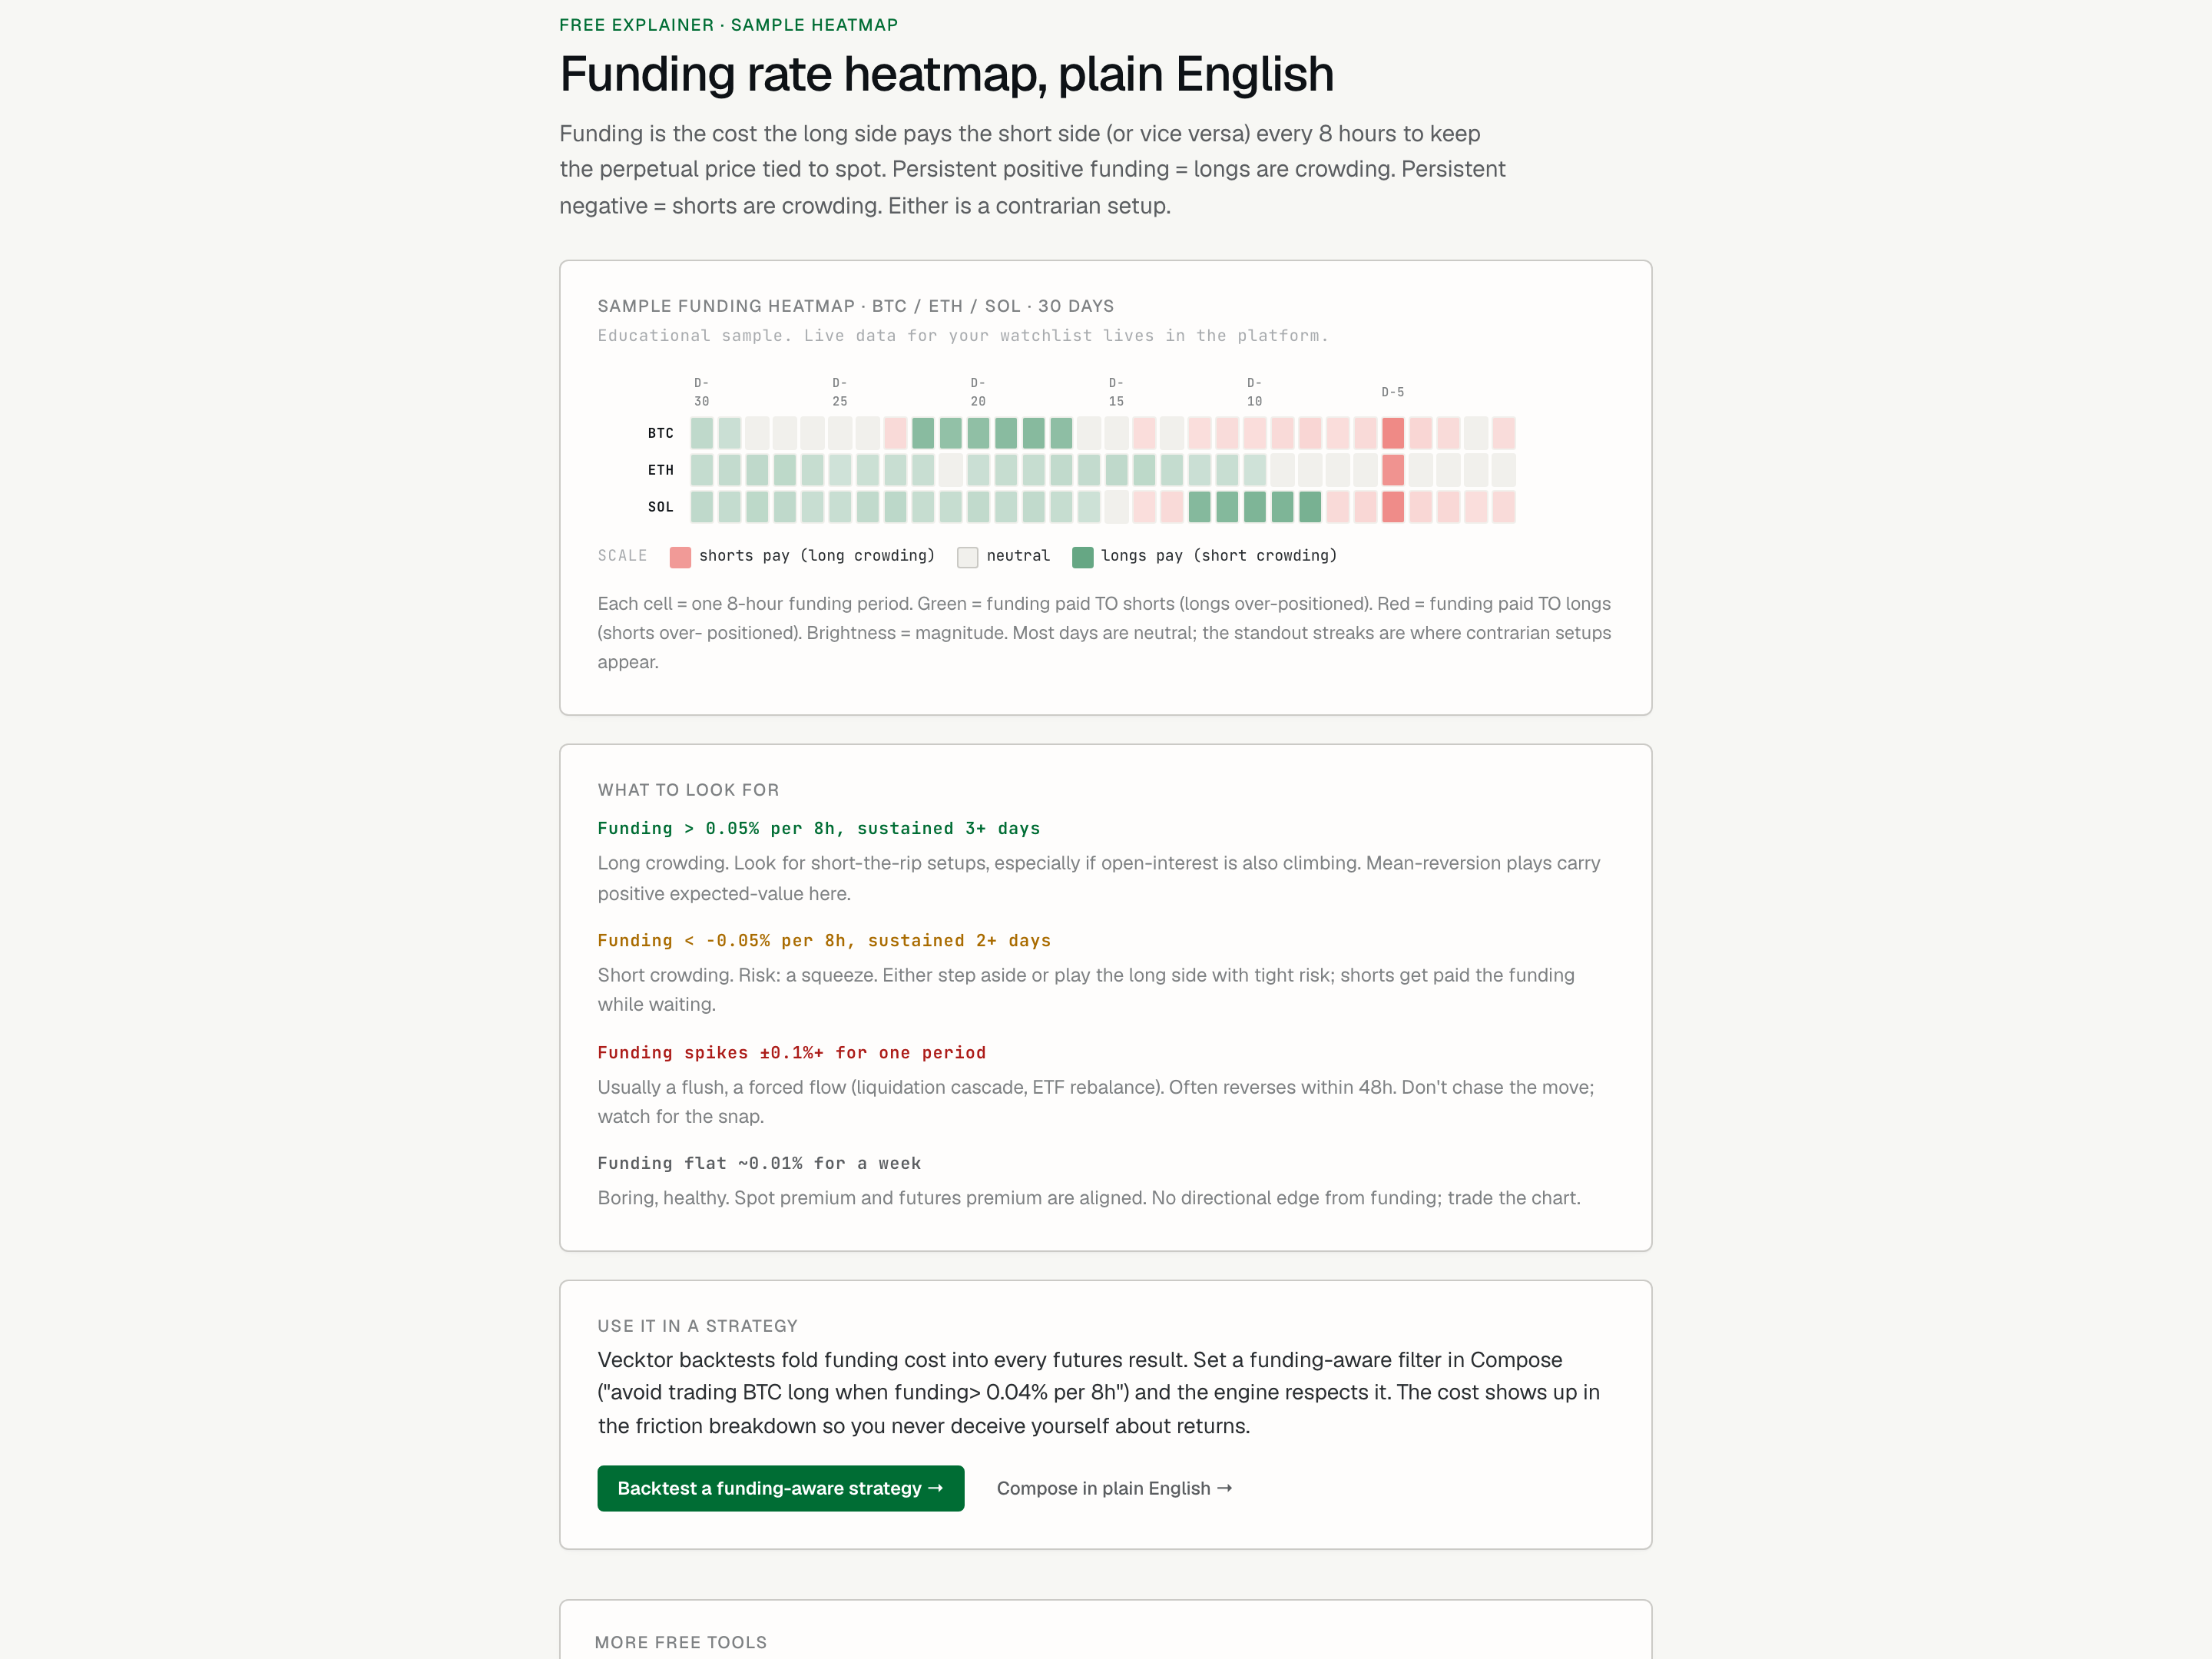
- Spot a green streak (longs are crowding, short-the-rip setup)
- Check other rows for streaks (one cell means little, a streak is the signal)
- Read the scale (color tells you who pays whom)
Spot crowded funding and act on it
A single cell means little. A streak in one direction is the signal. Crowding is a contrarian setup, not a green light.
- Look for sustained green above 0.05 percent per 8h for 3 or more days: long crowding, a short-the-rip setup, stronger if open interest is also climbing.
- Look for sustained red below -0.05 percent per 8h for 2 or more days: short crowding, with squeeze risk. Either step aside or play the long side with tight risk.
- Treat a one-period spike past 0.1 percent as a flush or forced flow. It often reverses within 48 hours, so do not chase it.
- Treat a flat week near 0.01 percent as boring and healthy. There is no funding edge, so trade the chart instead.
- Click Backtest a funding-aware strategy, or Compose in plain English, to test an idea that respects funding.
 1Streaks worth acting on2Test the idea
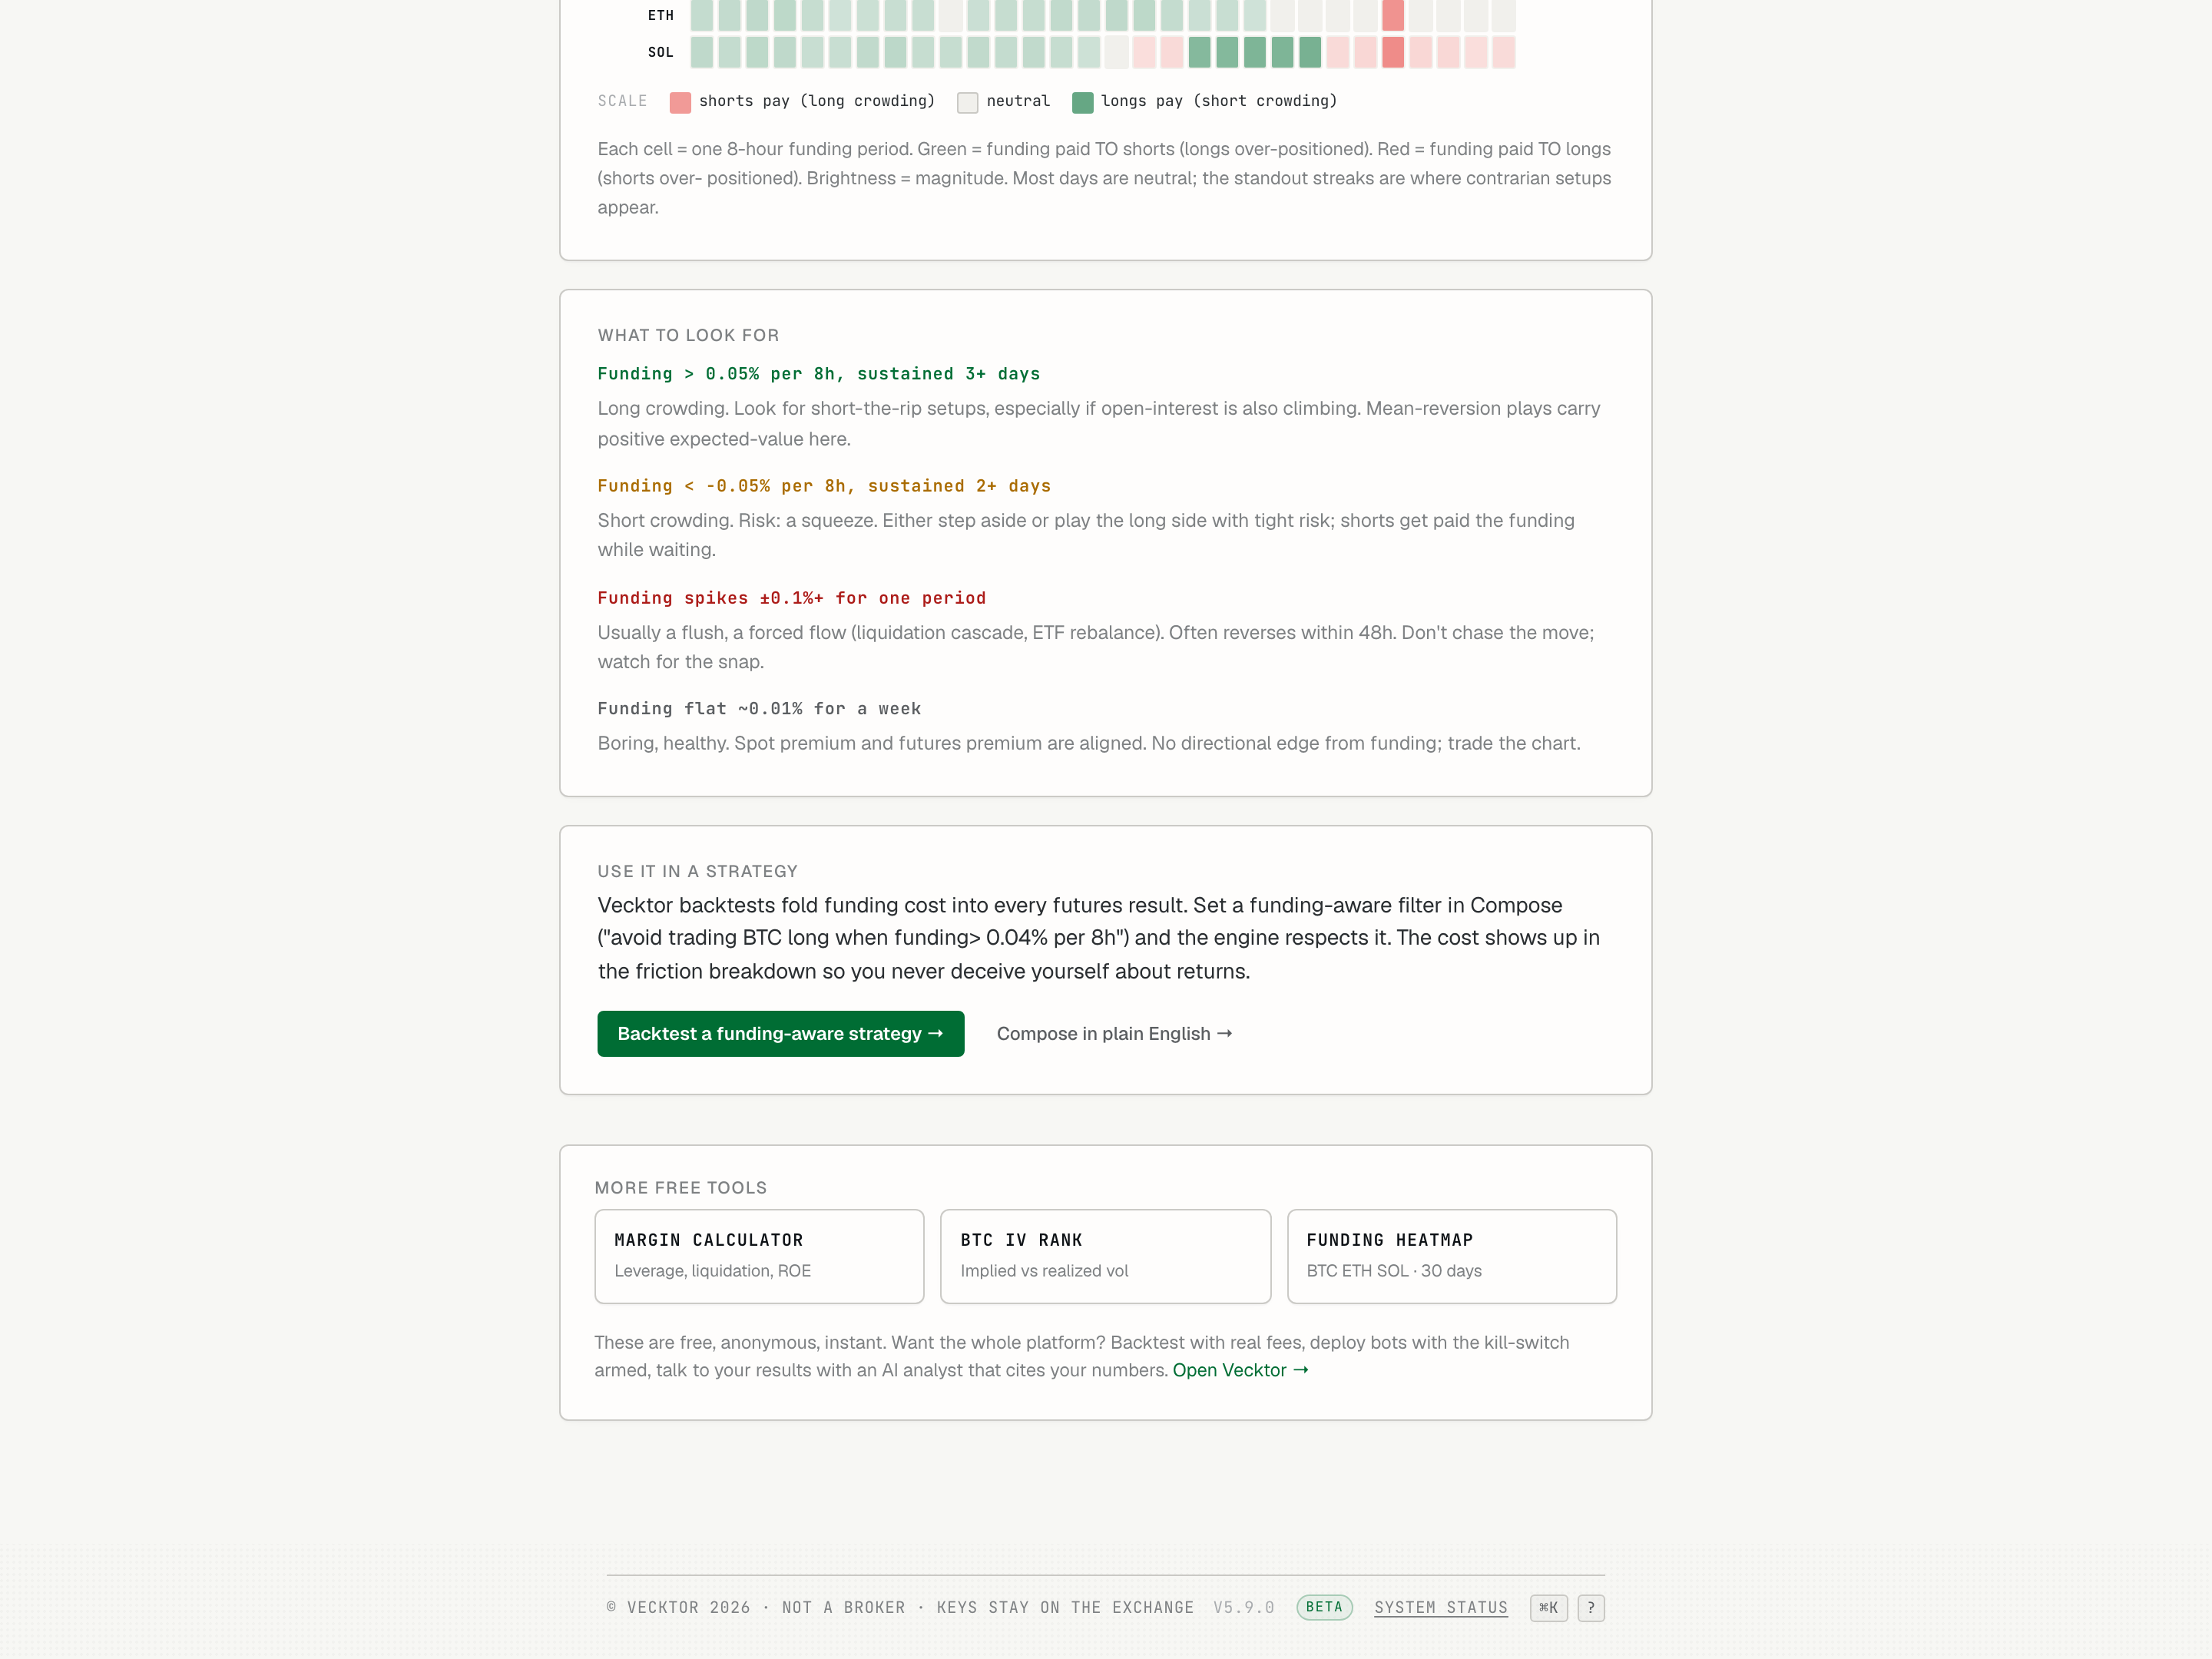
Take a tool into the platform
Each tool ends with a call to action into the full app, where the numbers are live and backtests are honest.
- From IV rank, open the options builder to use live IV rank inside a real structure.
- From the funding heatmap, open futures or Compose to backtest with funding cost folded in.
- Run a backtest there: every result is net of fees and slippage (the gap between expected and real fill price), already deducted.
- Backtesting, deploying, monitoring, and the kill-switch (the one-tap stop on a live bot) are free. The AI features (Compose, the analyst, the optimizer) run on credits, with a free monthly grant in beta.