Read your dashboard
The dashboard is where you land after you sign in. It opens with live prices, gives you market context at a glance, three quick ways to start a strategy, and a cockpit view of your bots, broker connection, and AI credits. This guide walks through every part of the page and what each number means.
The ticker and the greeting
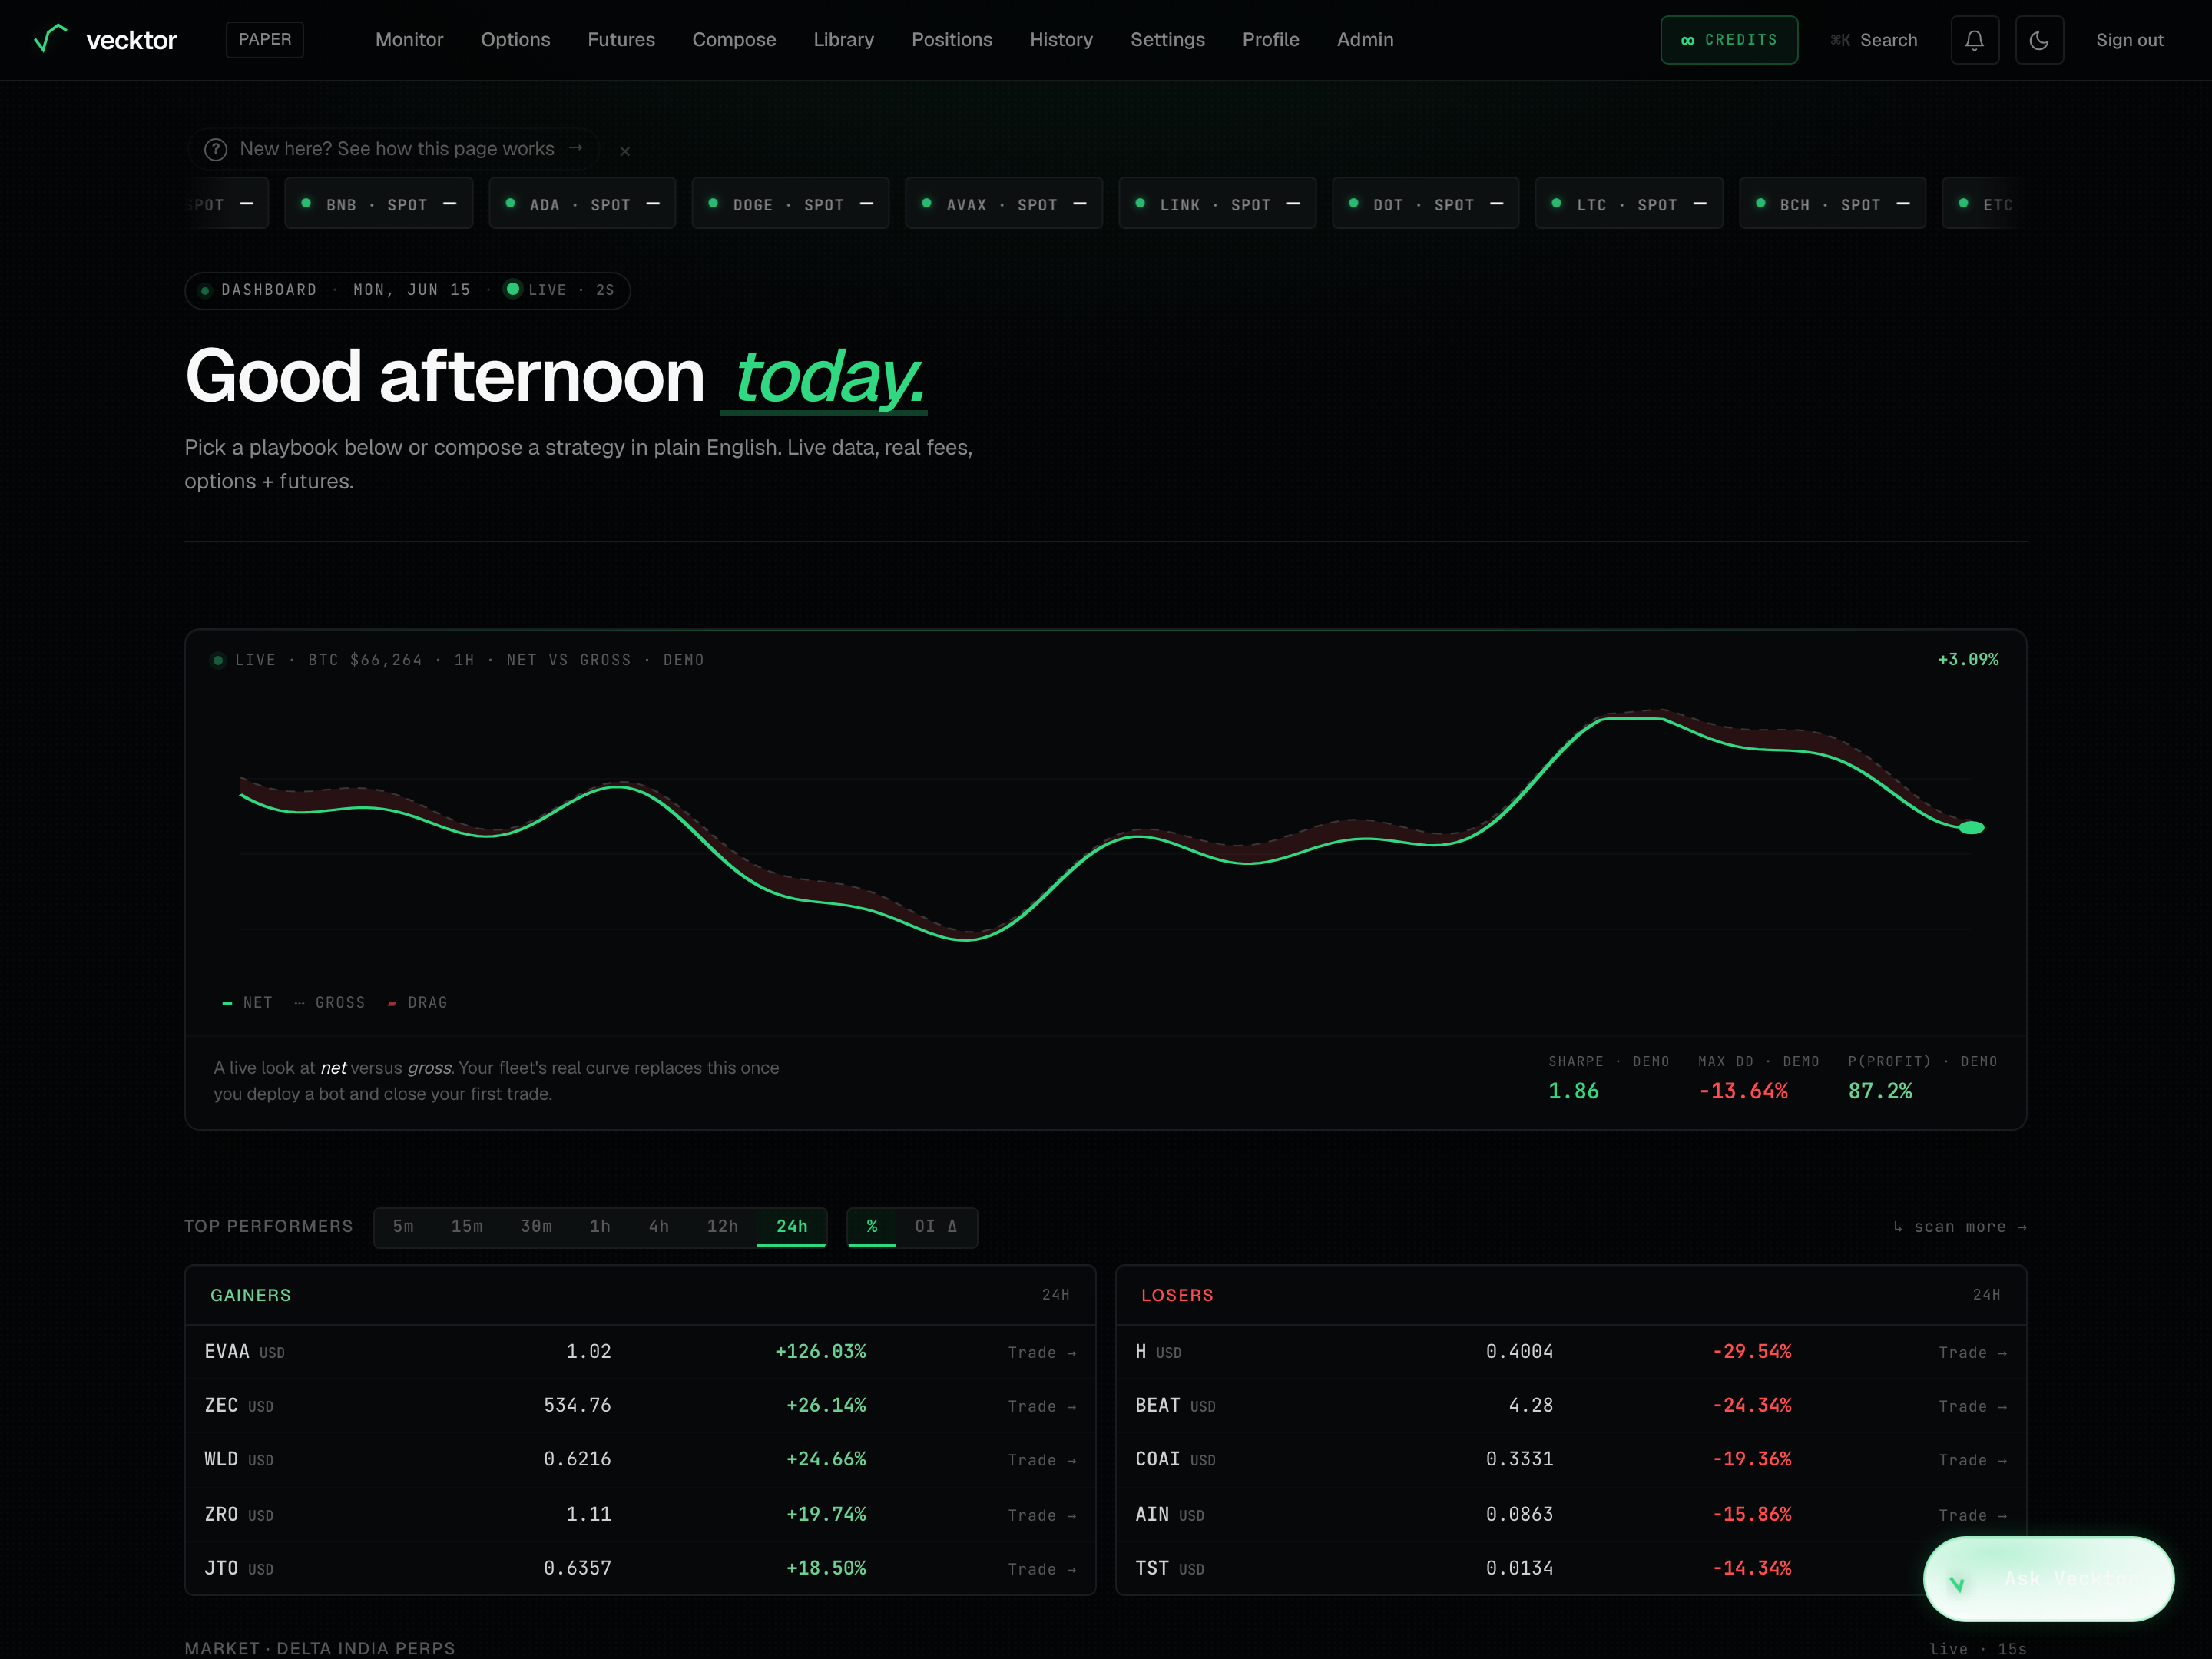
The top of the page reads as alive on first paint. A scrolling price strip runs across the top, and a greeting names you and the day.
- Read the scrolling ticker at the very top. It shows the live spot price (the current index price) for every coin we support.
- Hover the ticker to pause it so you can read a price without chasing it.
- Watch a price flash green or red as a fresh tick arrives.
- Read the greeting below it. It changes with the time of day in your timezone and uses your first name if you set one.
 2Greeting (time of day + your name)
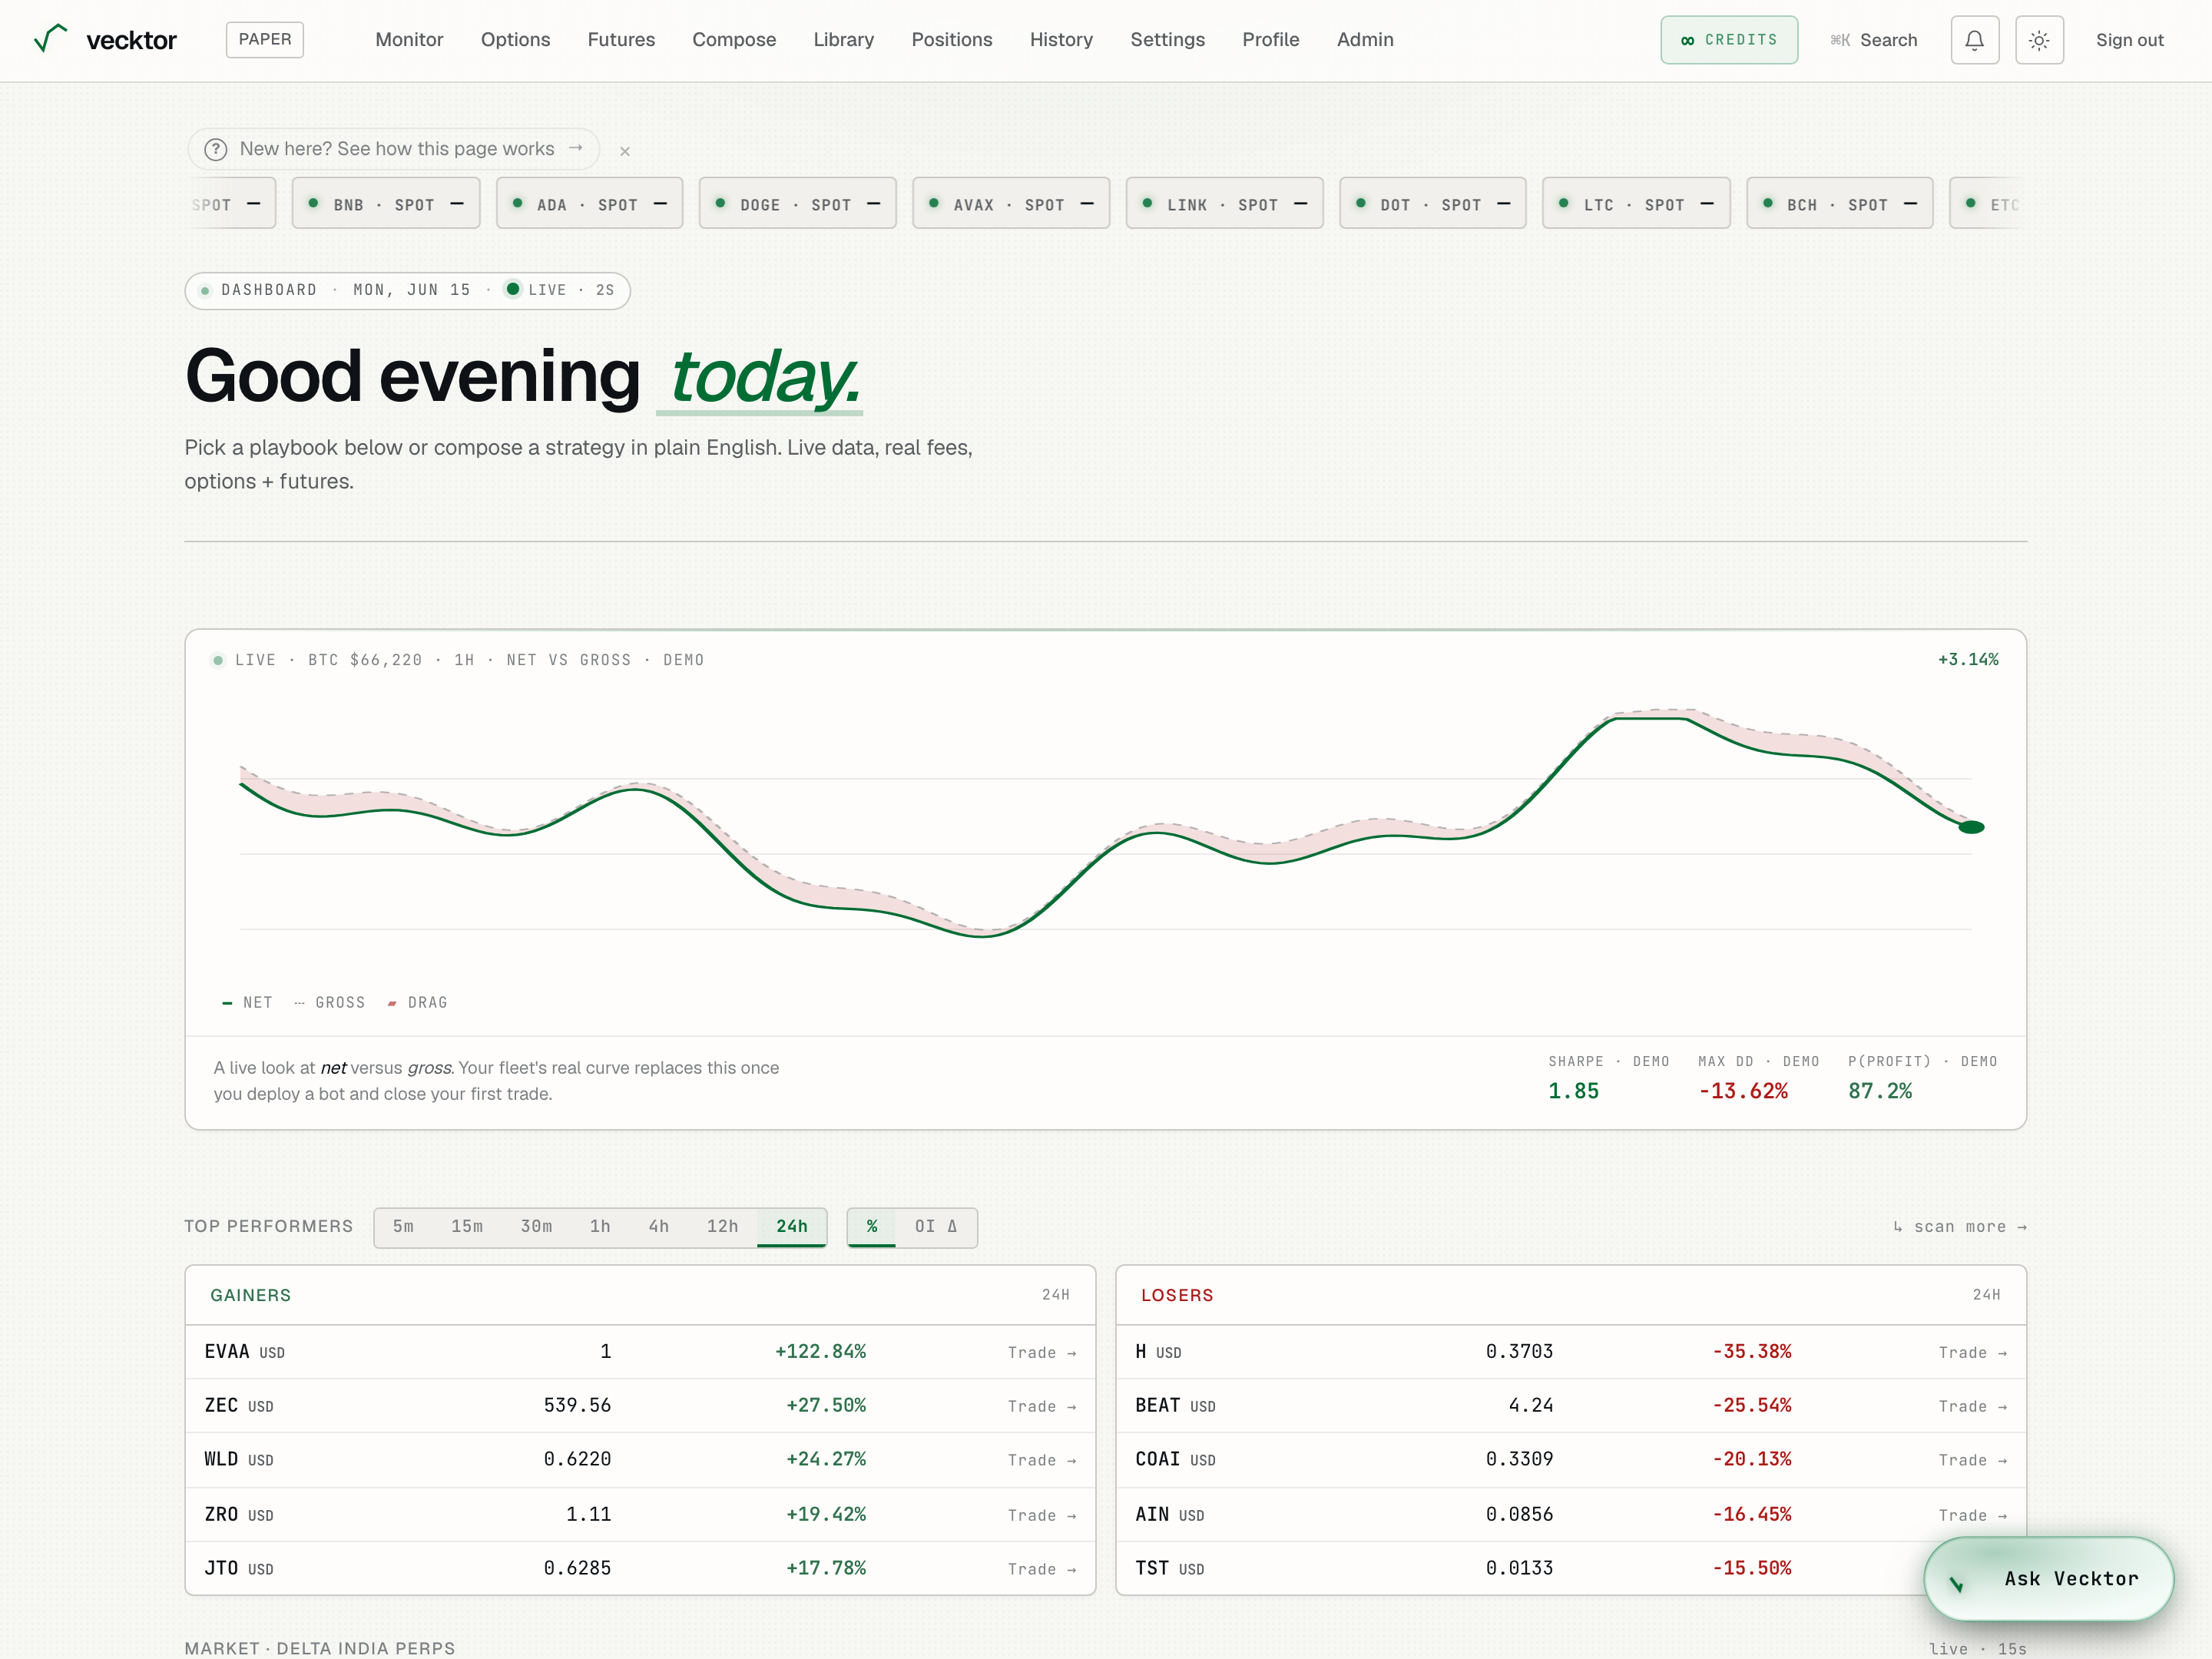
- Read a live price (spot, the current index price)
- Watch it flash on a tick (green up, red down)
- Read the greeting (time of day, your first name)
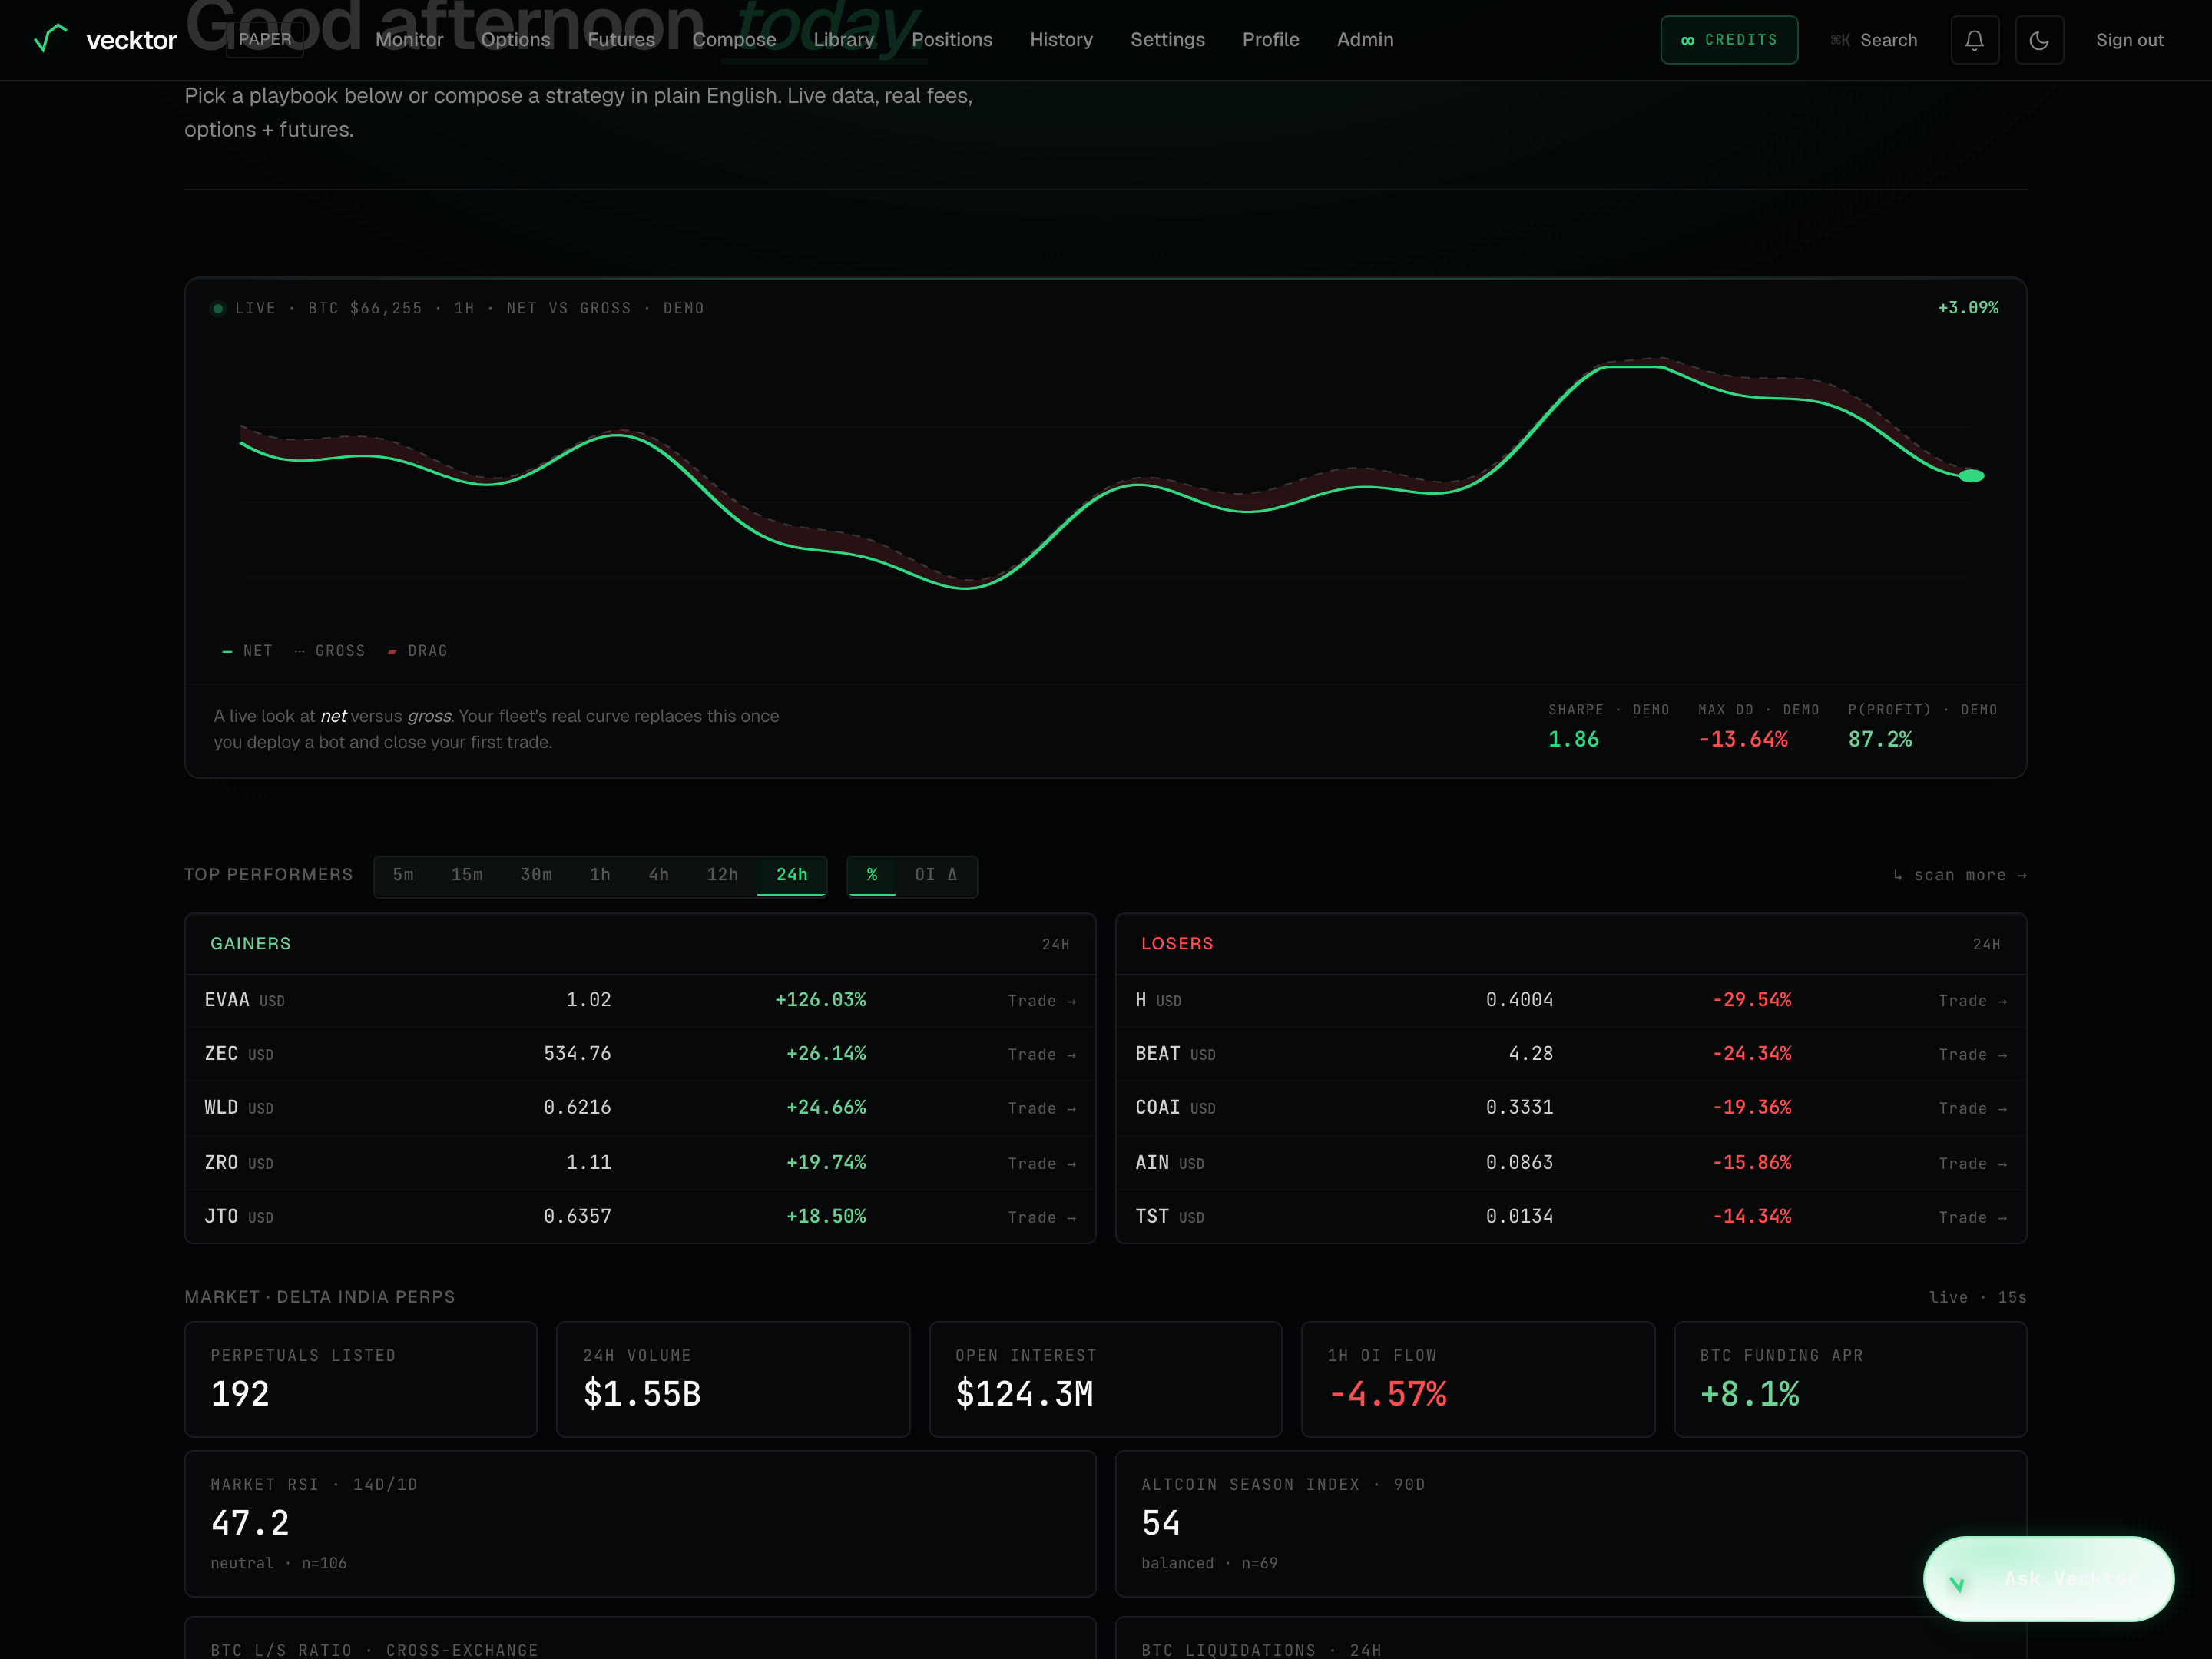
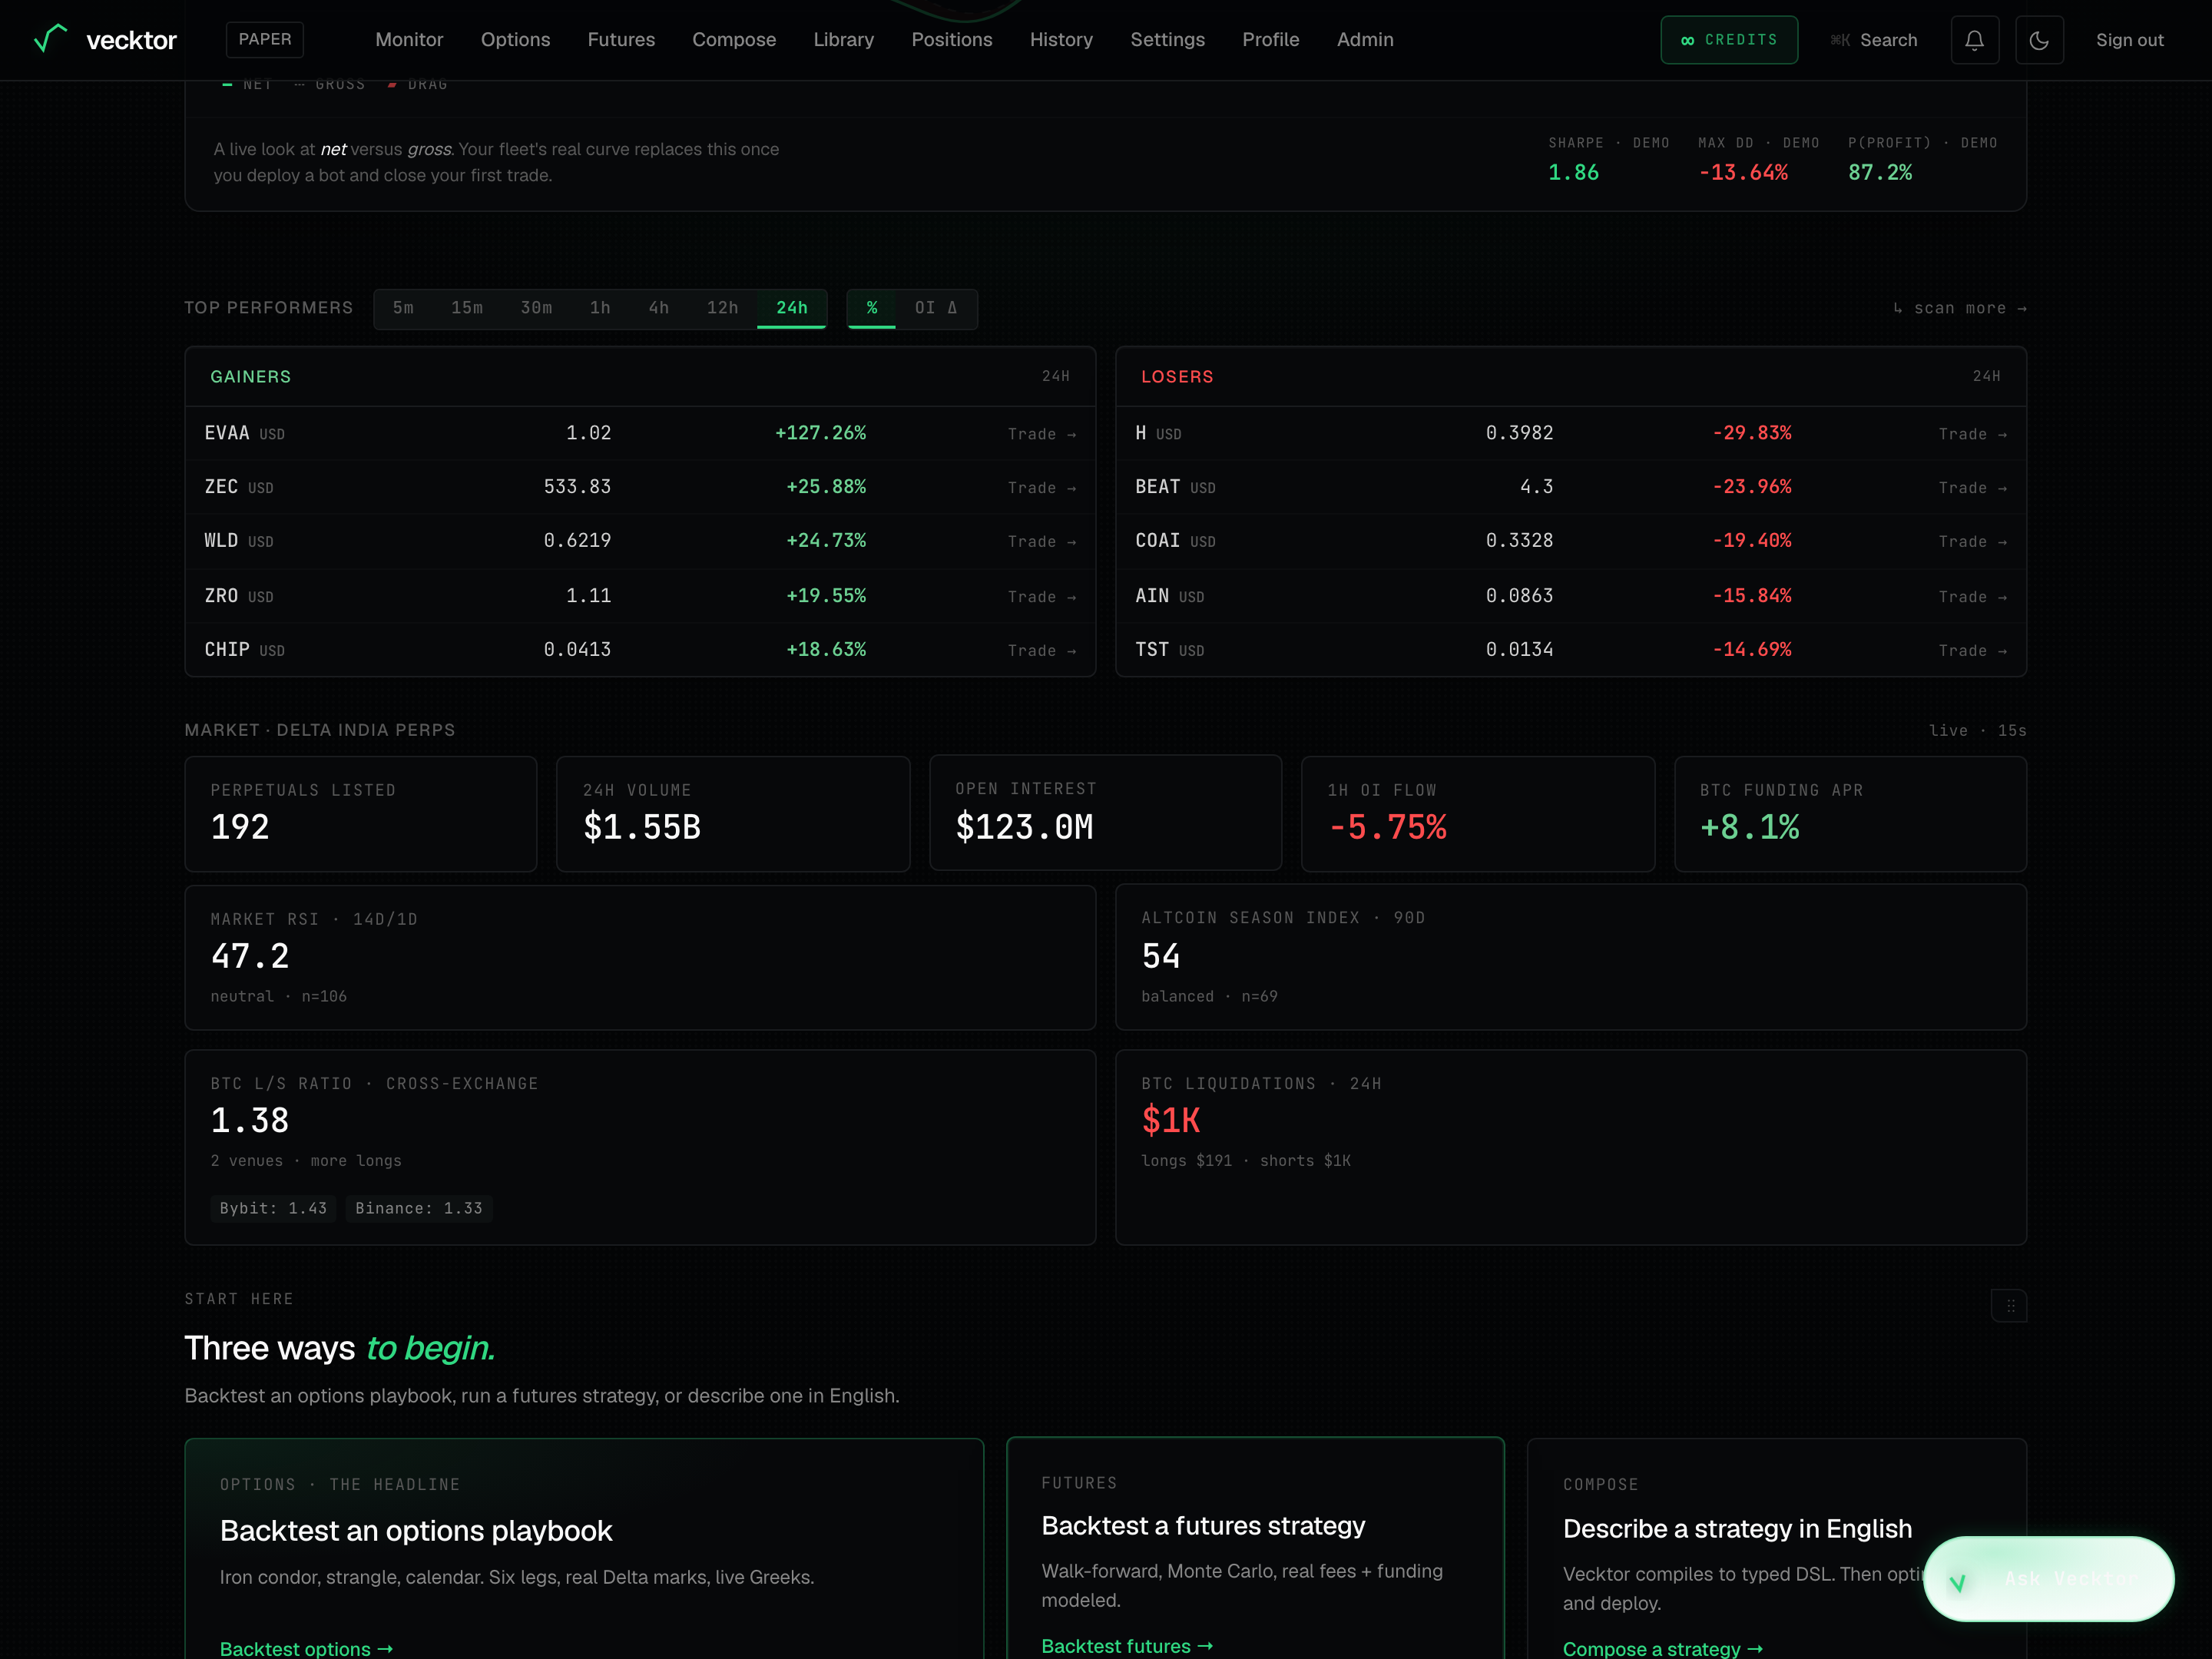
The net vs gross chart
Below the greeting is a wide animated chart that compares NET to GROSS. NET is what you actually keep after costs. GROSS is what you would have made before costs. The shaded DRAG wedge between the two lines is the drag from fees, funding (the periodic payment between long and short holders of a perpetual) and slippage (the gap between the price you expected and the price you got). The legend under the chart names the three: NET, GROSS, DRAG.
- Read the solid line. The legend labels it NET, the headline.
- Read the faint dashed line above it. The legend labels it GROSS, before costs.
- Look at the shaded wedge between them. The legend labels it DRAG, what costs took out.
- Check the header label. It tells you whether you are looking at a DEMO curve or YOUR FLEET.
- Read the three stats in the footer: SHARPE (return per unit of risk), MAX DD (the worst peak-to-trough drop), and P(PROFIT) (the share of trades that closed in profit). On the demo curve each is suffixed DEMO; on your real fleet each is suffixed 24H.
 1NET (solid) vs GROSS (dashed), DRAG wedge2SHARPE / MAX DD / P(PROFIT)
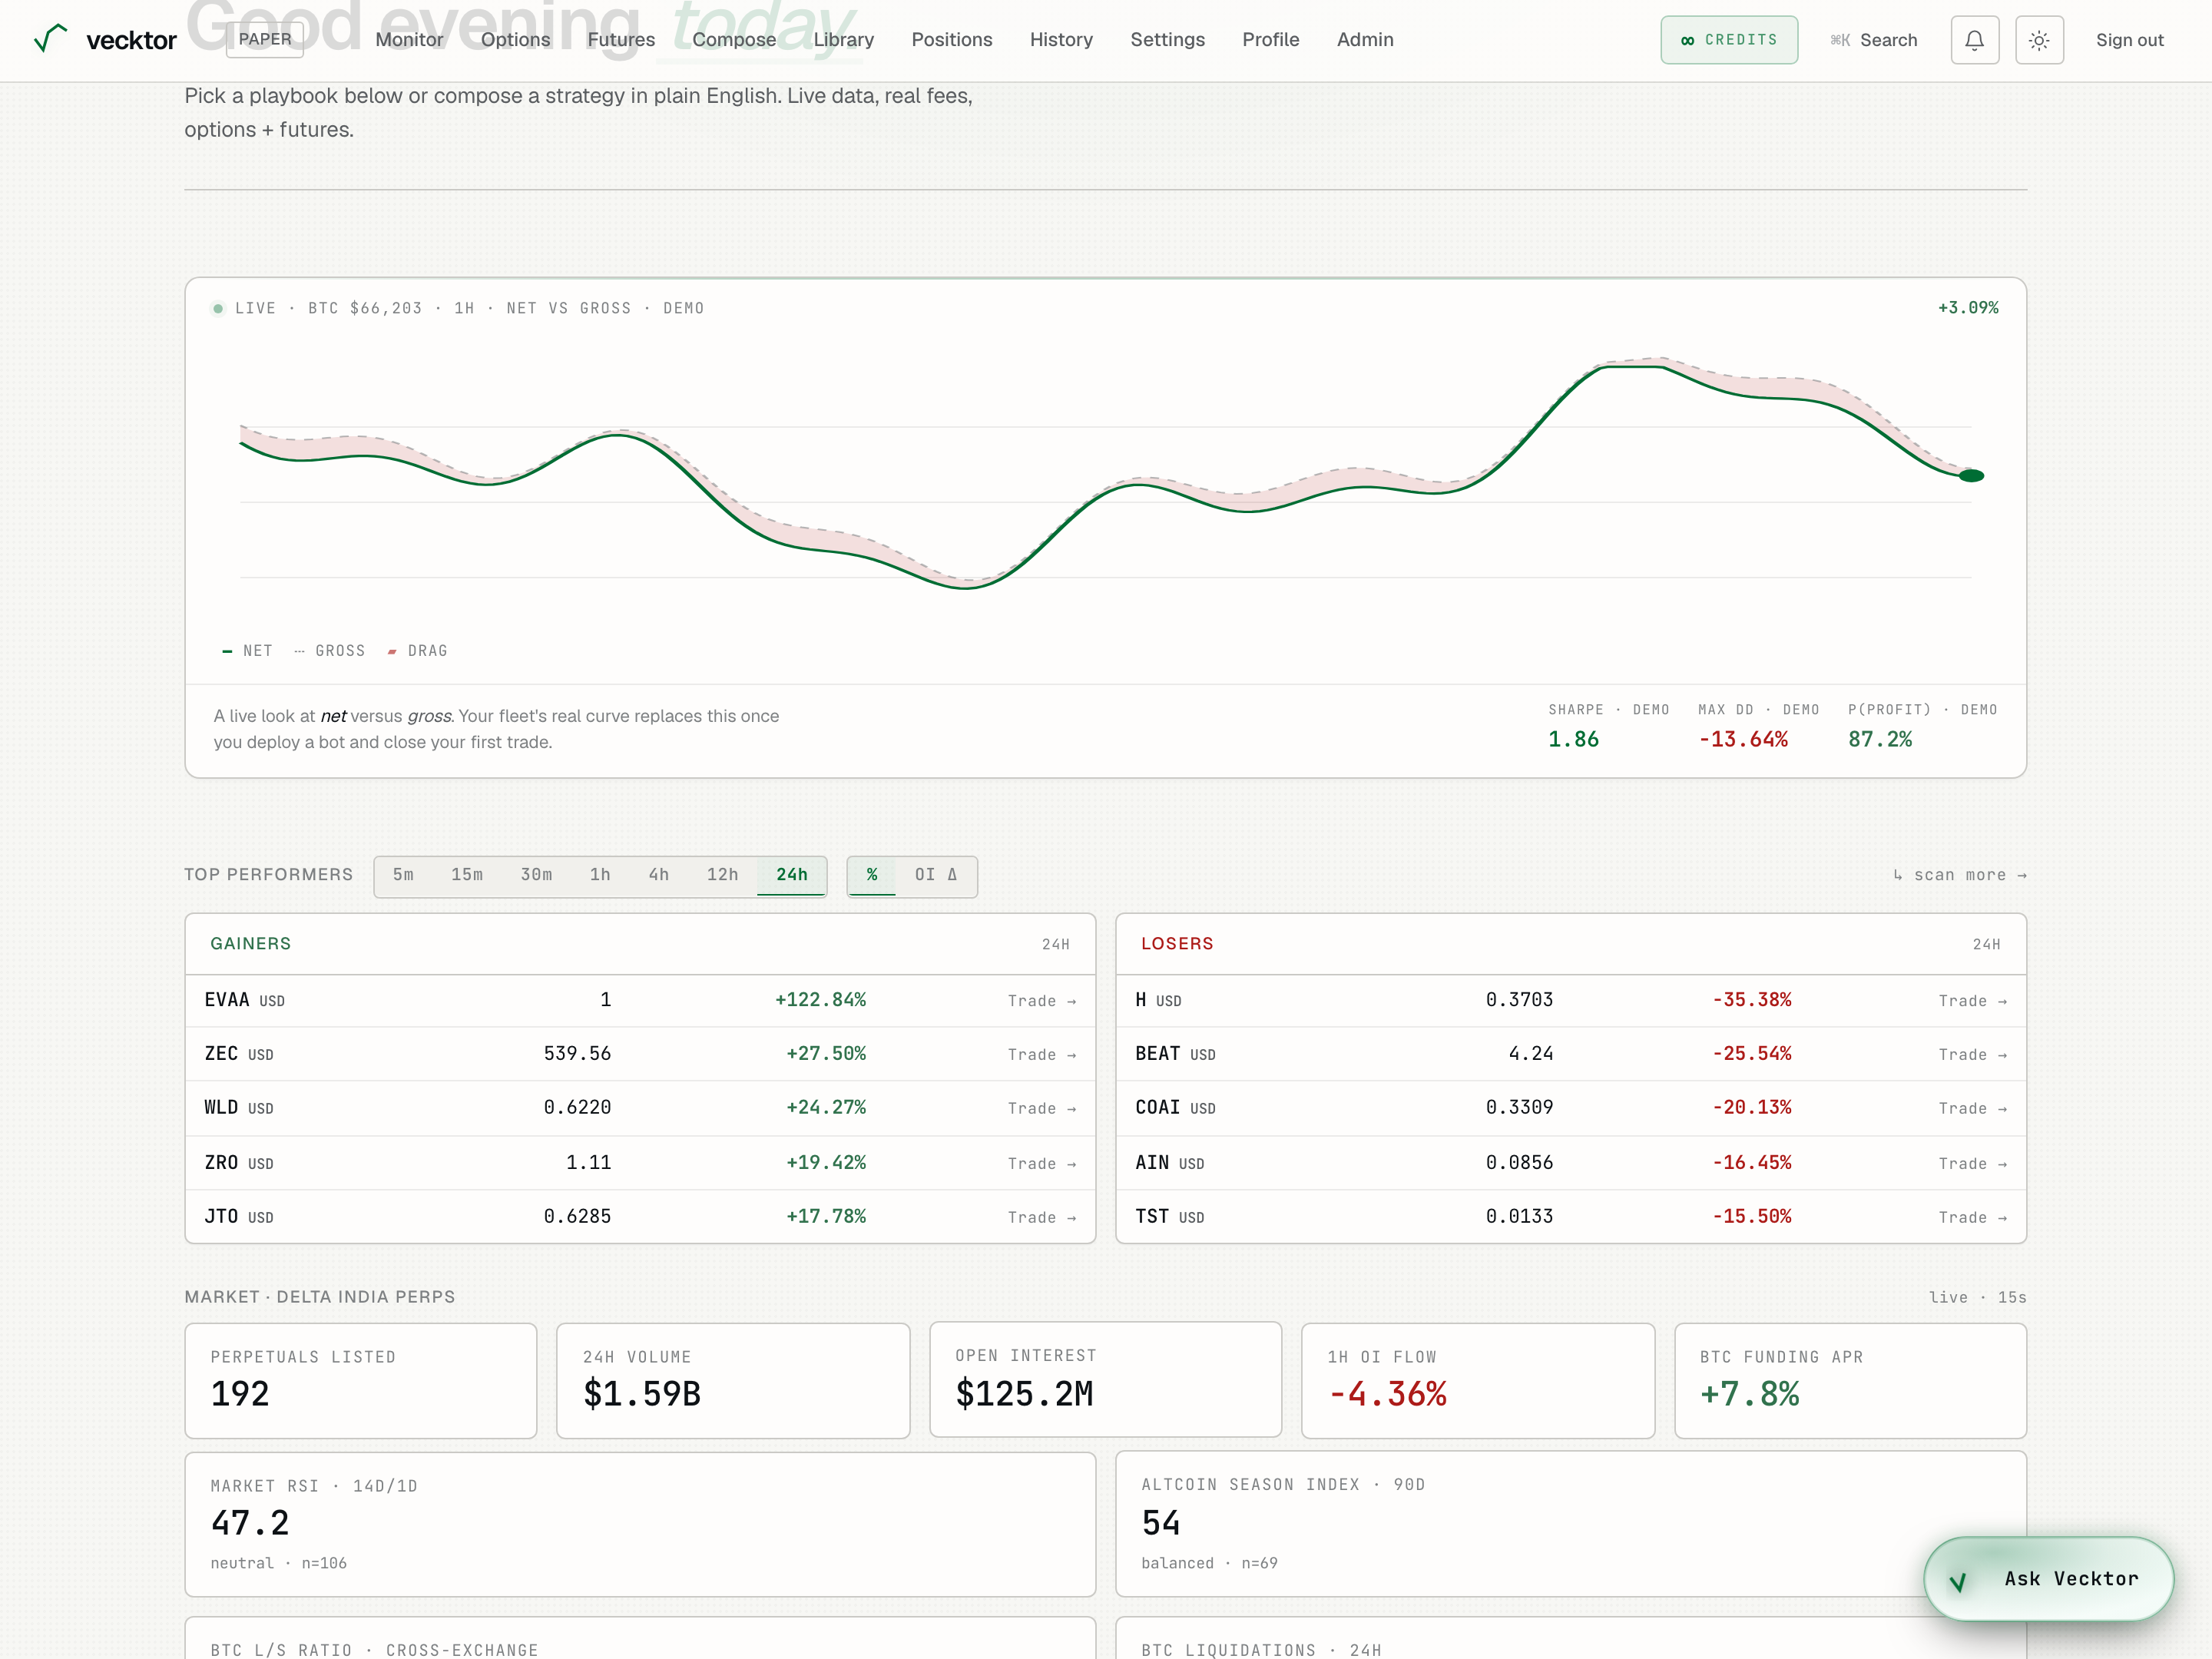
- Check the DEMO label (this is illustrative until you have trades)
- Compare the two lines (the DRAG wedge is fees, funding and slippage)
- Read SHARPE (return per unit of risk)
- Read MAX DD (the worst peak-to-trough drop)
Pick a strategy with the wizard
The card titled Vecktor · pick a strategy with you asks three short questions and lands you on a backtest. It is a fast way to start when you do not know what to run.
- Pick a Risk appetite: Conservative, Moderate, or Aggressive.
- Pick a Trading cadence: Weekly, Daily, or Intraday.
- Pick a Strategy style: Trend, Breakout, Mean reversion, or Surprise me.
- Click Show my three. You get three matches, ranked.
- Click a match to open it preloaded on the futures page, ready to run.
- Click Dismiss if you do not want this card. It stays gone on your next visit.
- Pick a risk appetite
- Pick a cadence
- Pick a style
- Click Show my three (no AI, no credits)
- Click a match (opens a backtest preloaded)
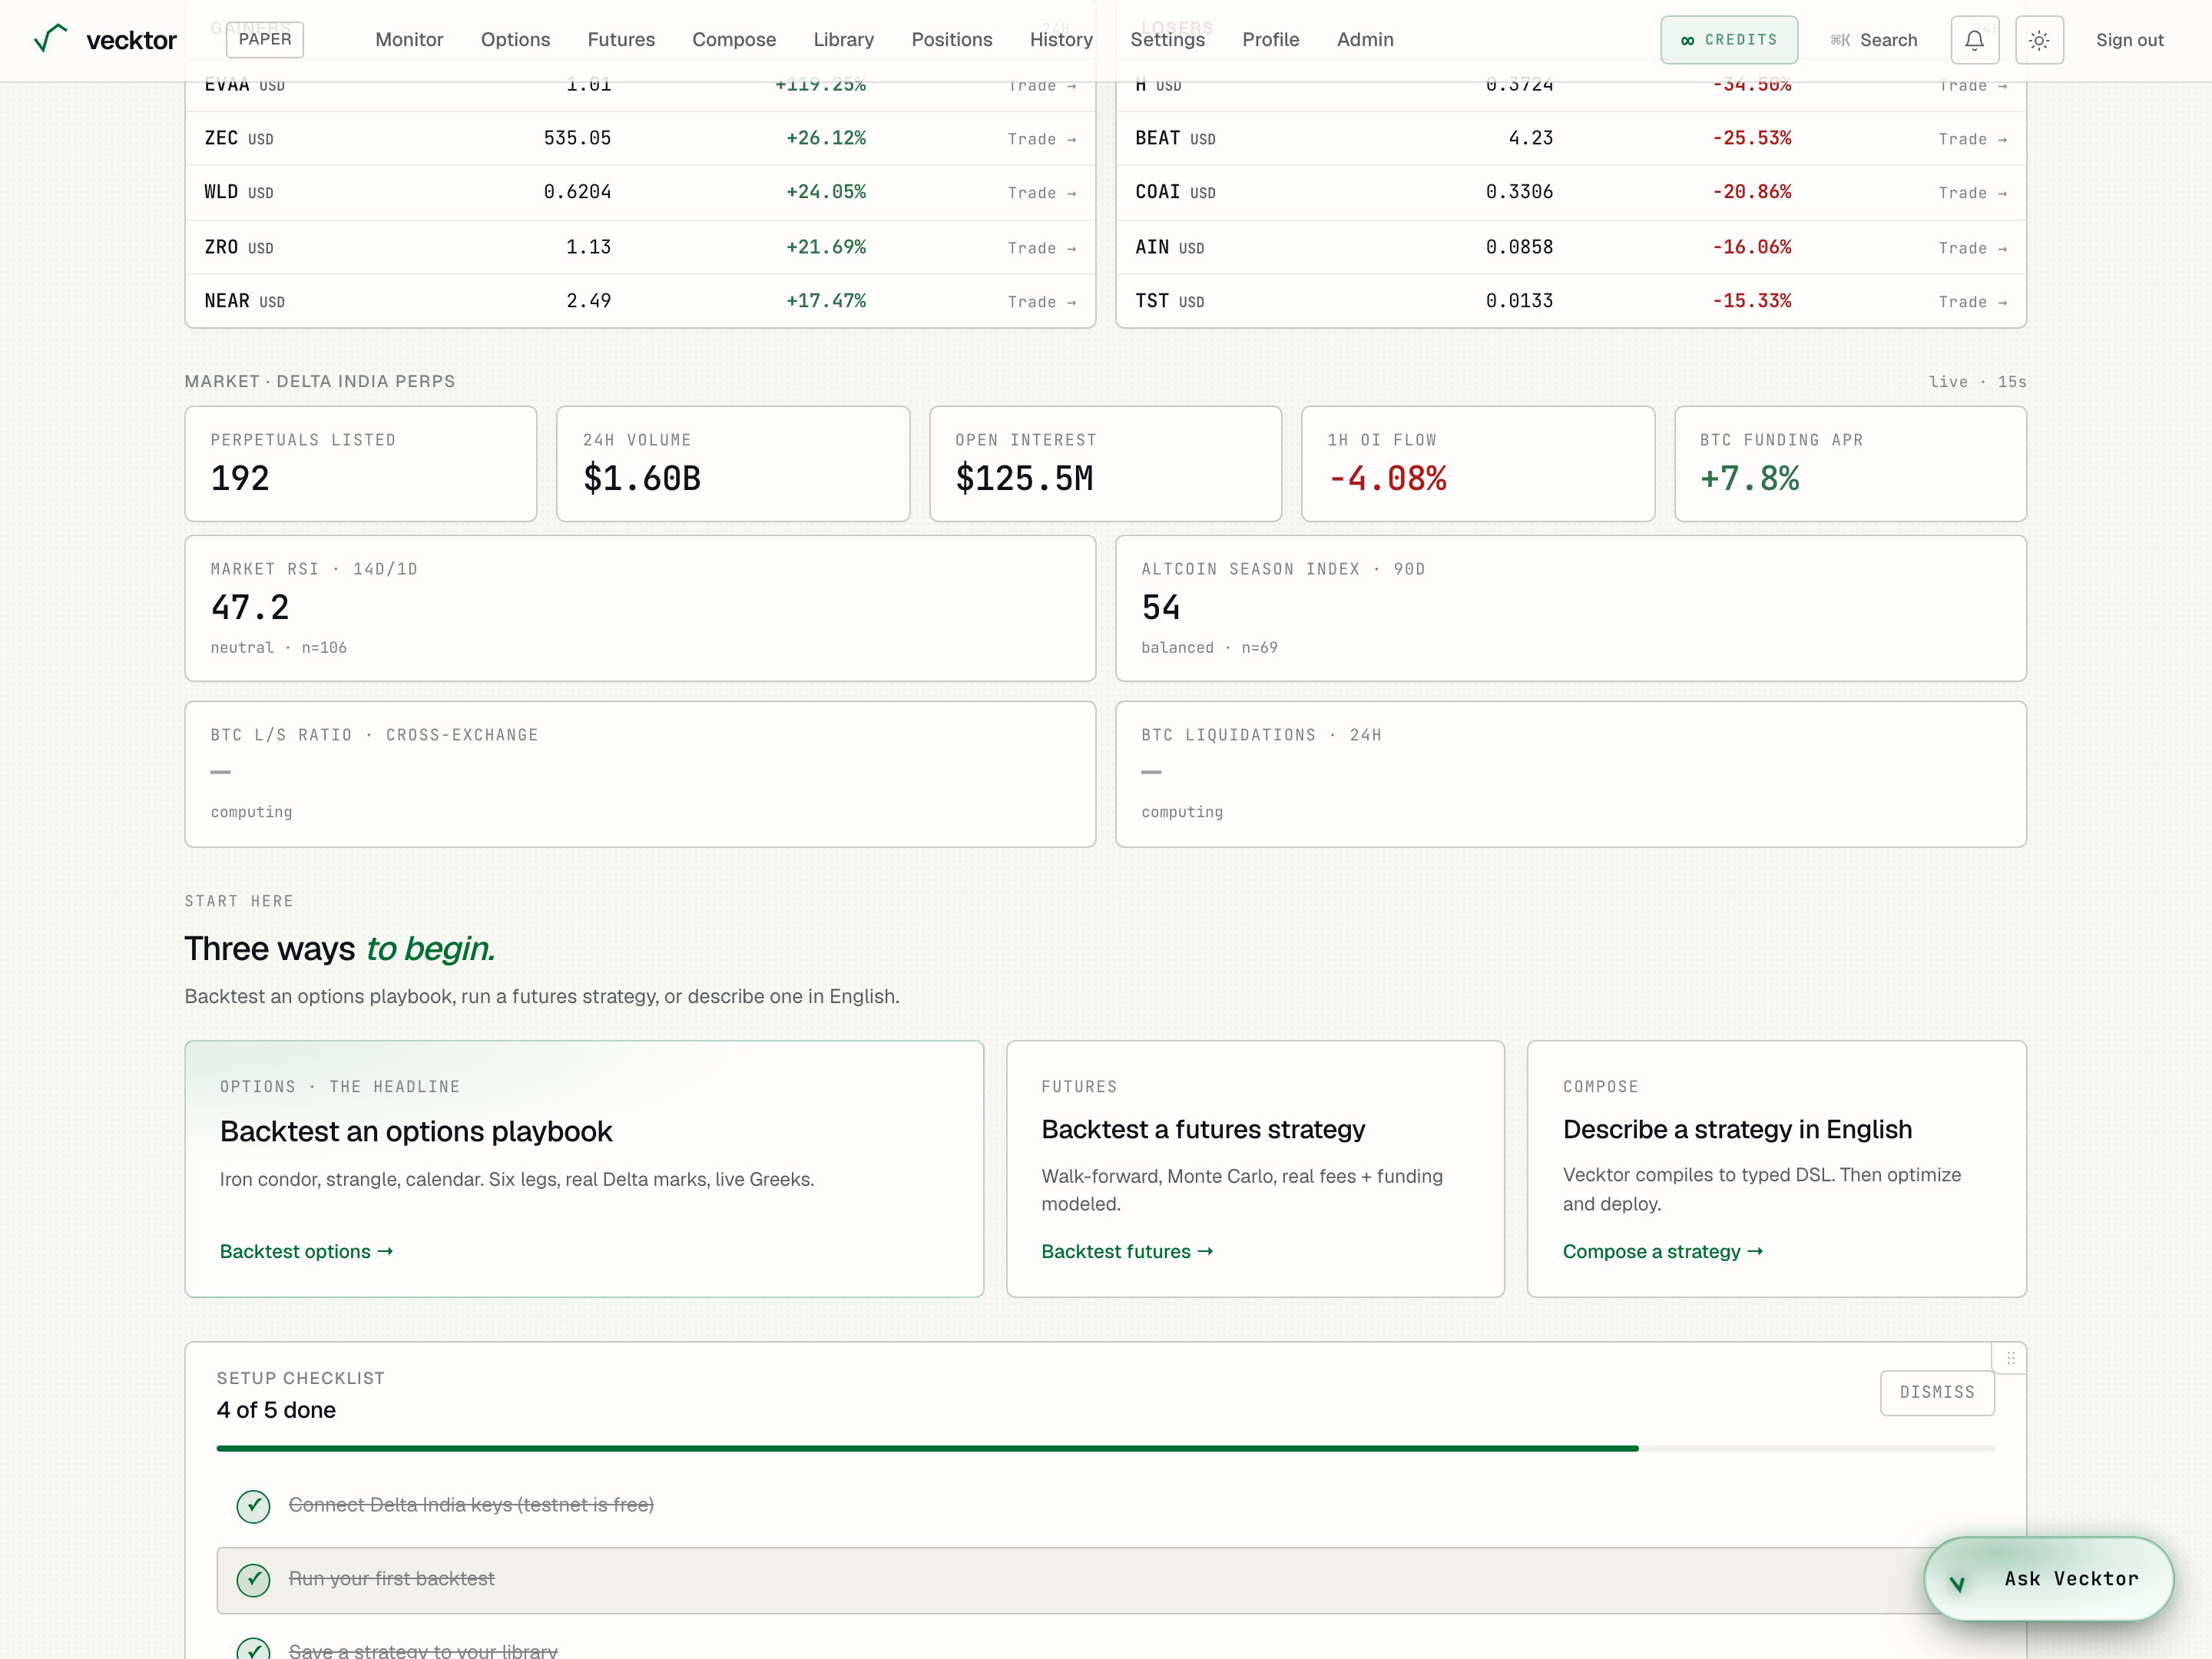
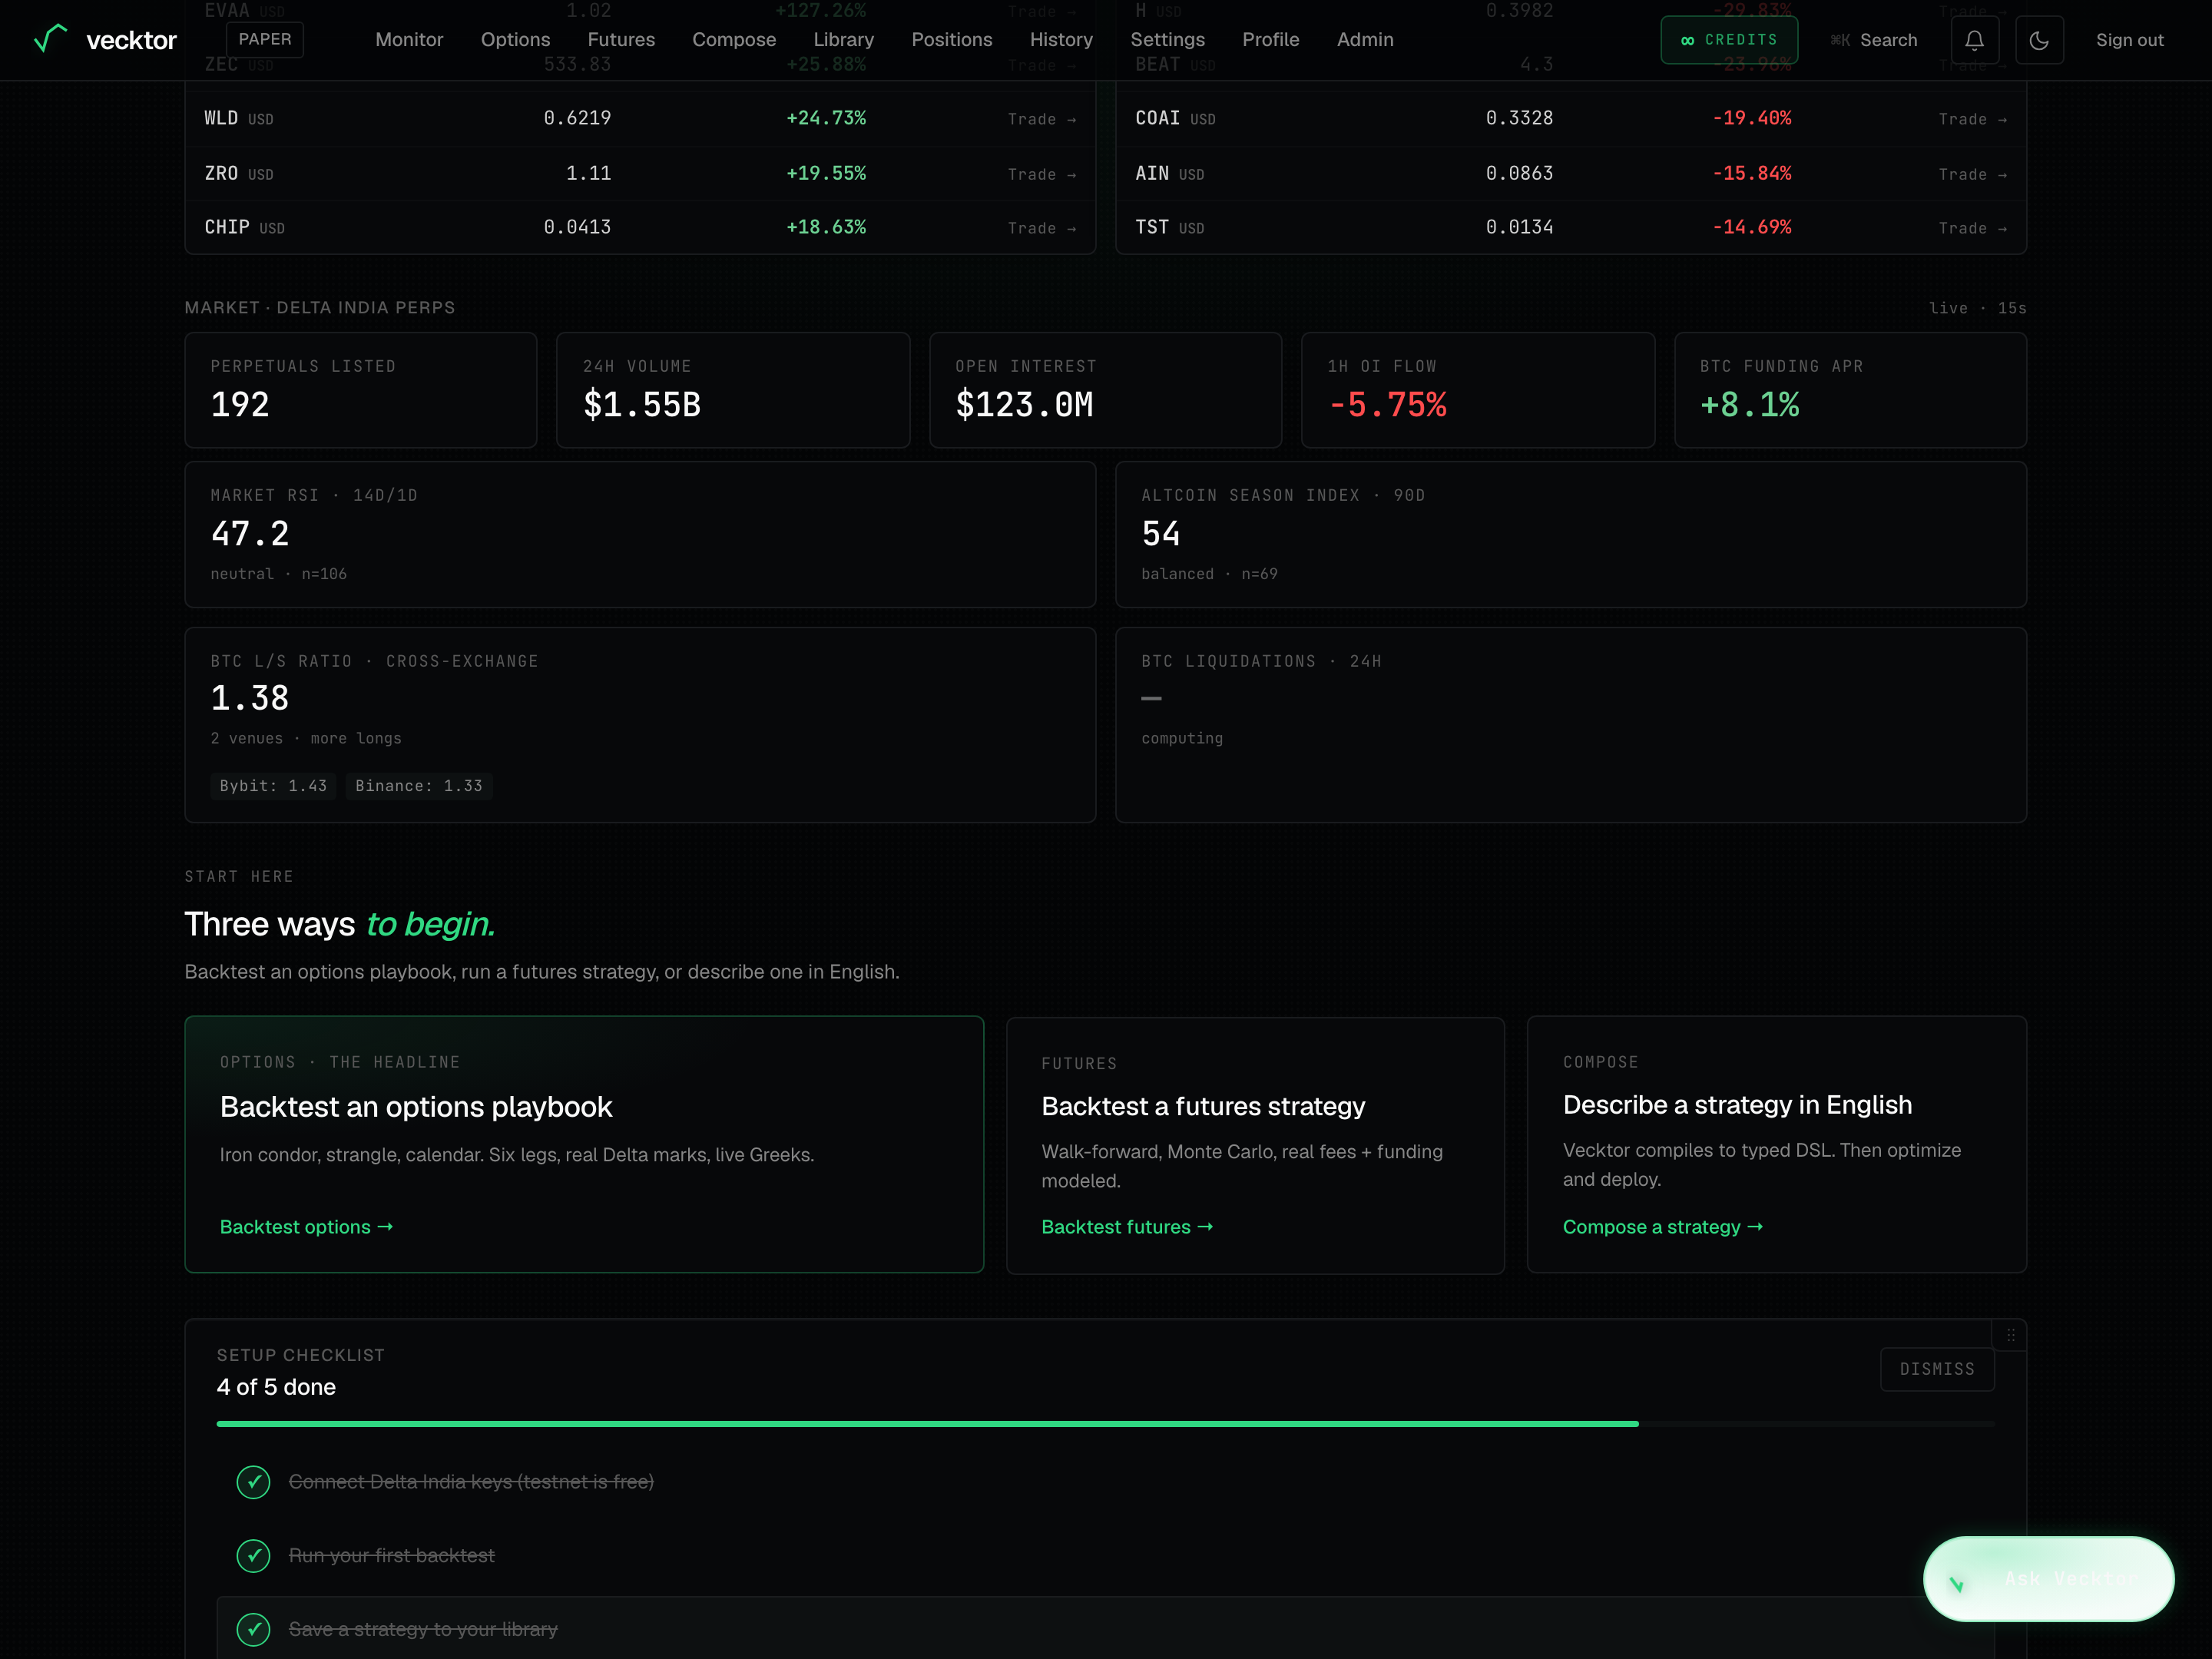
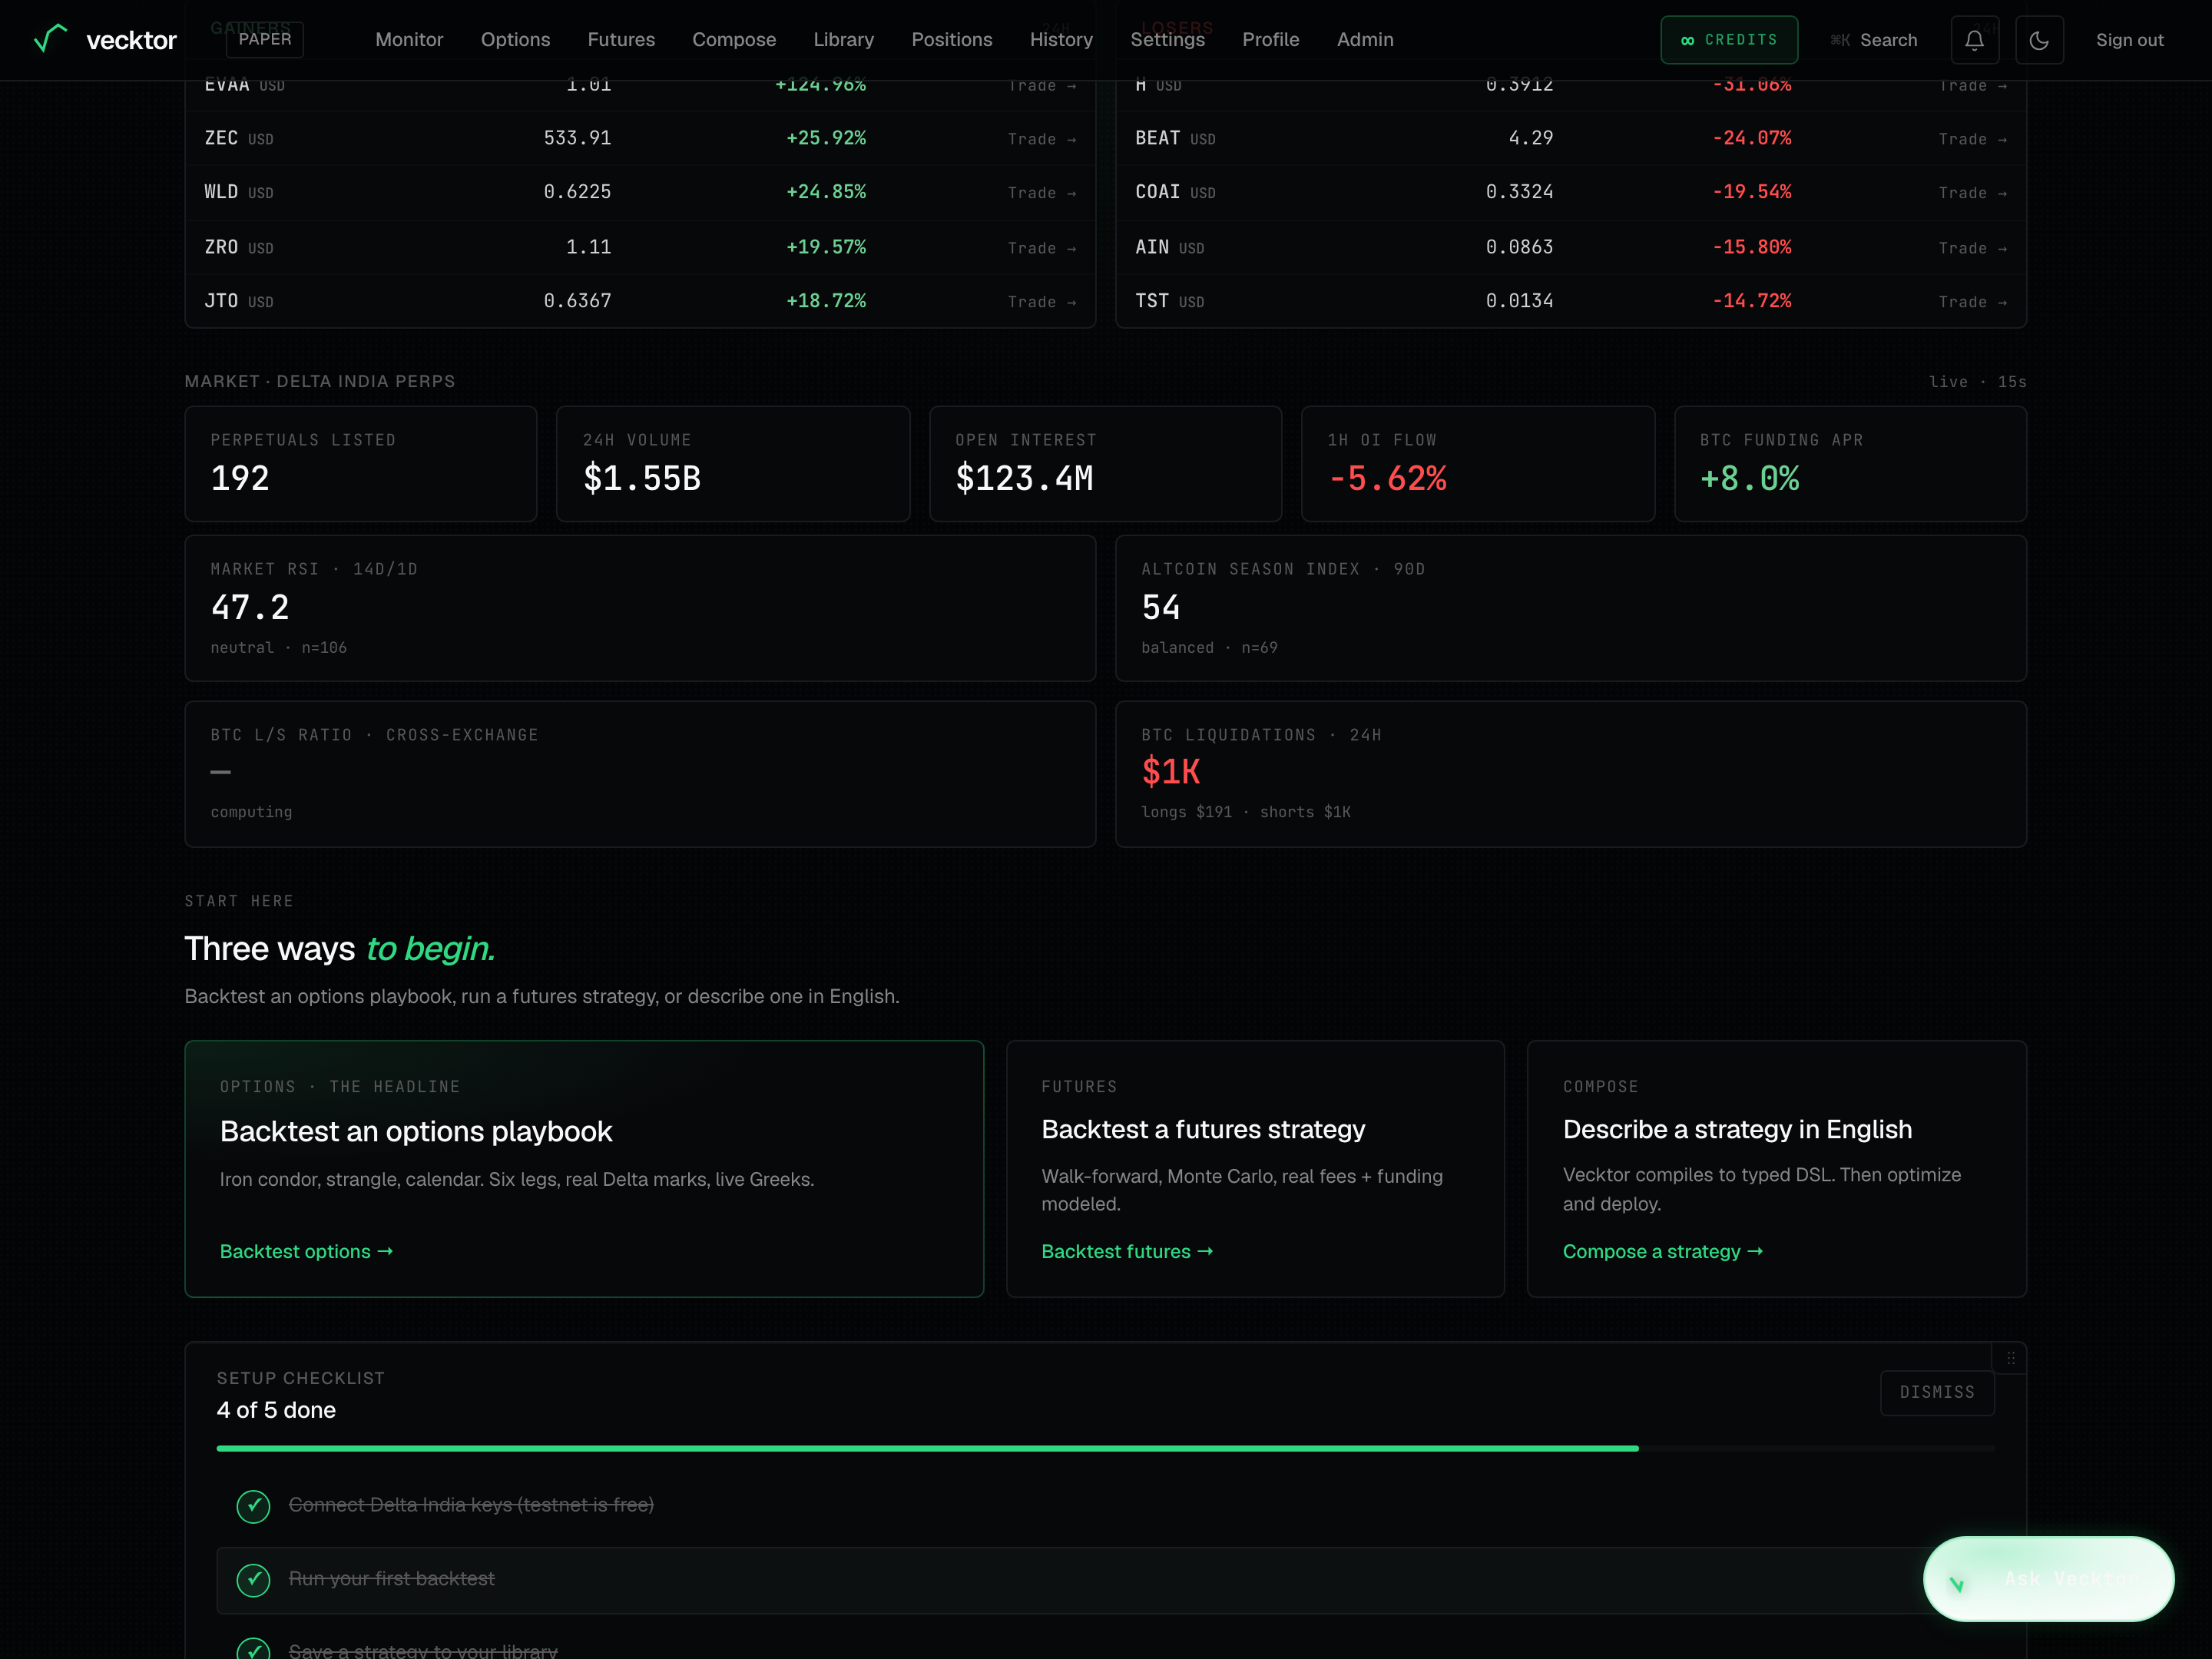
Top performers and OI movers
This panel shows the biggest movers split into Gainers and Losers, with a one-click way to trade each row. You can change the time window and switch what it ranks by.
- Read the two columns: Gainers on the left, Losers on the right.
- Click a time tab (5m, 15m, 30m, 1h, 4h, 12h, or 24h) to change the window the move is measured over.
- Click % to rank by price change, or OI Δ to rank by open interest change (open interest is the total size of open positions in that coin).
- Click any row, or its Trade arrow, to open that coin. BTC and ETH open on the options page; every other coin opens on the futures page.
- Click scan more to open the full scanner on the monitor page.
 1% or OI Δ pivot2Gainers3Losers
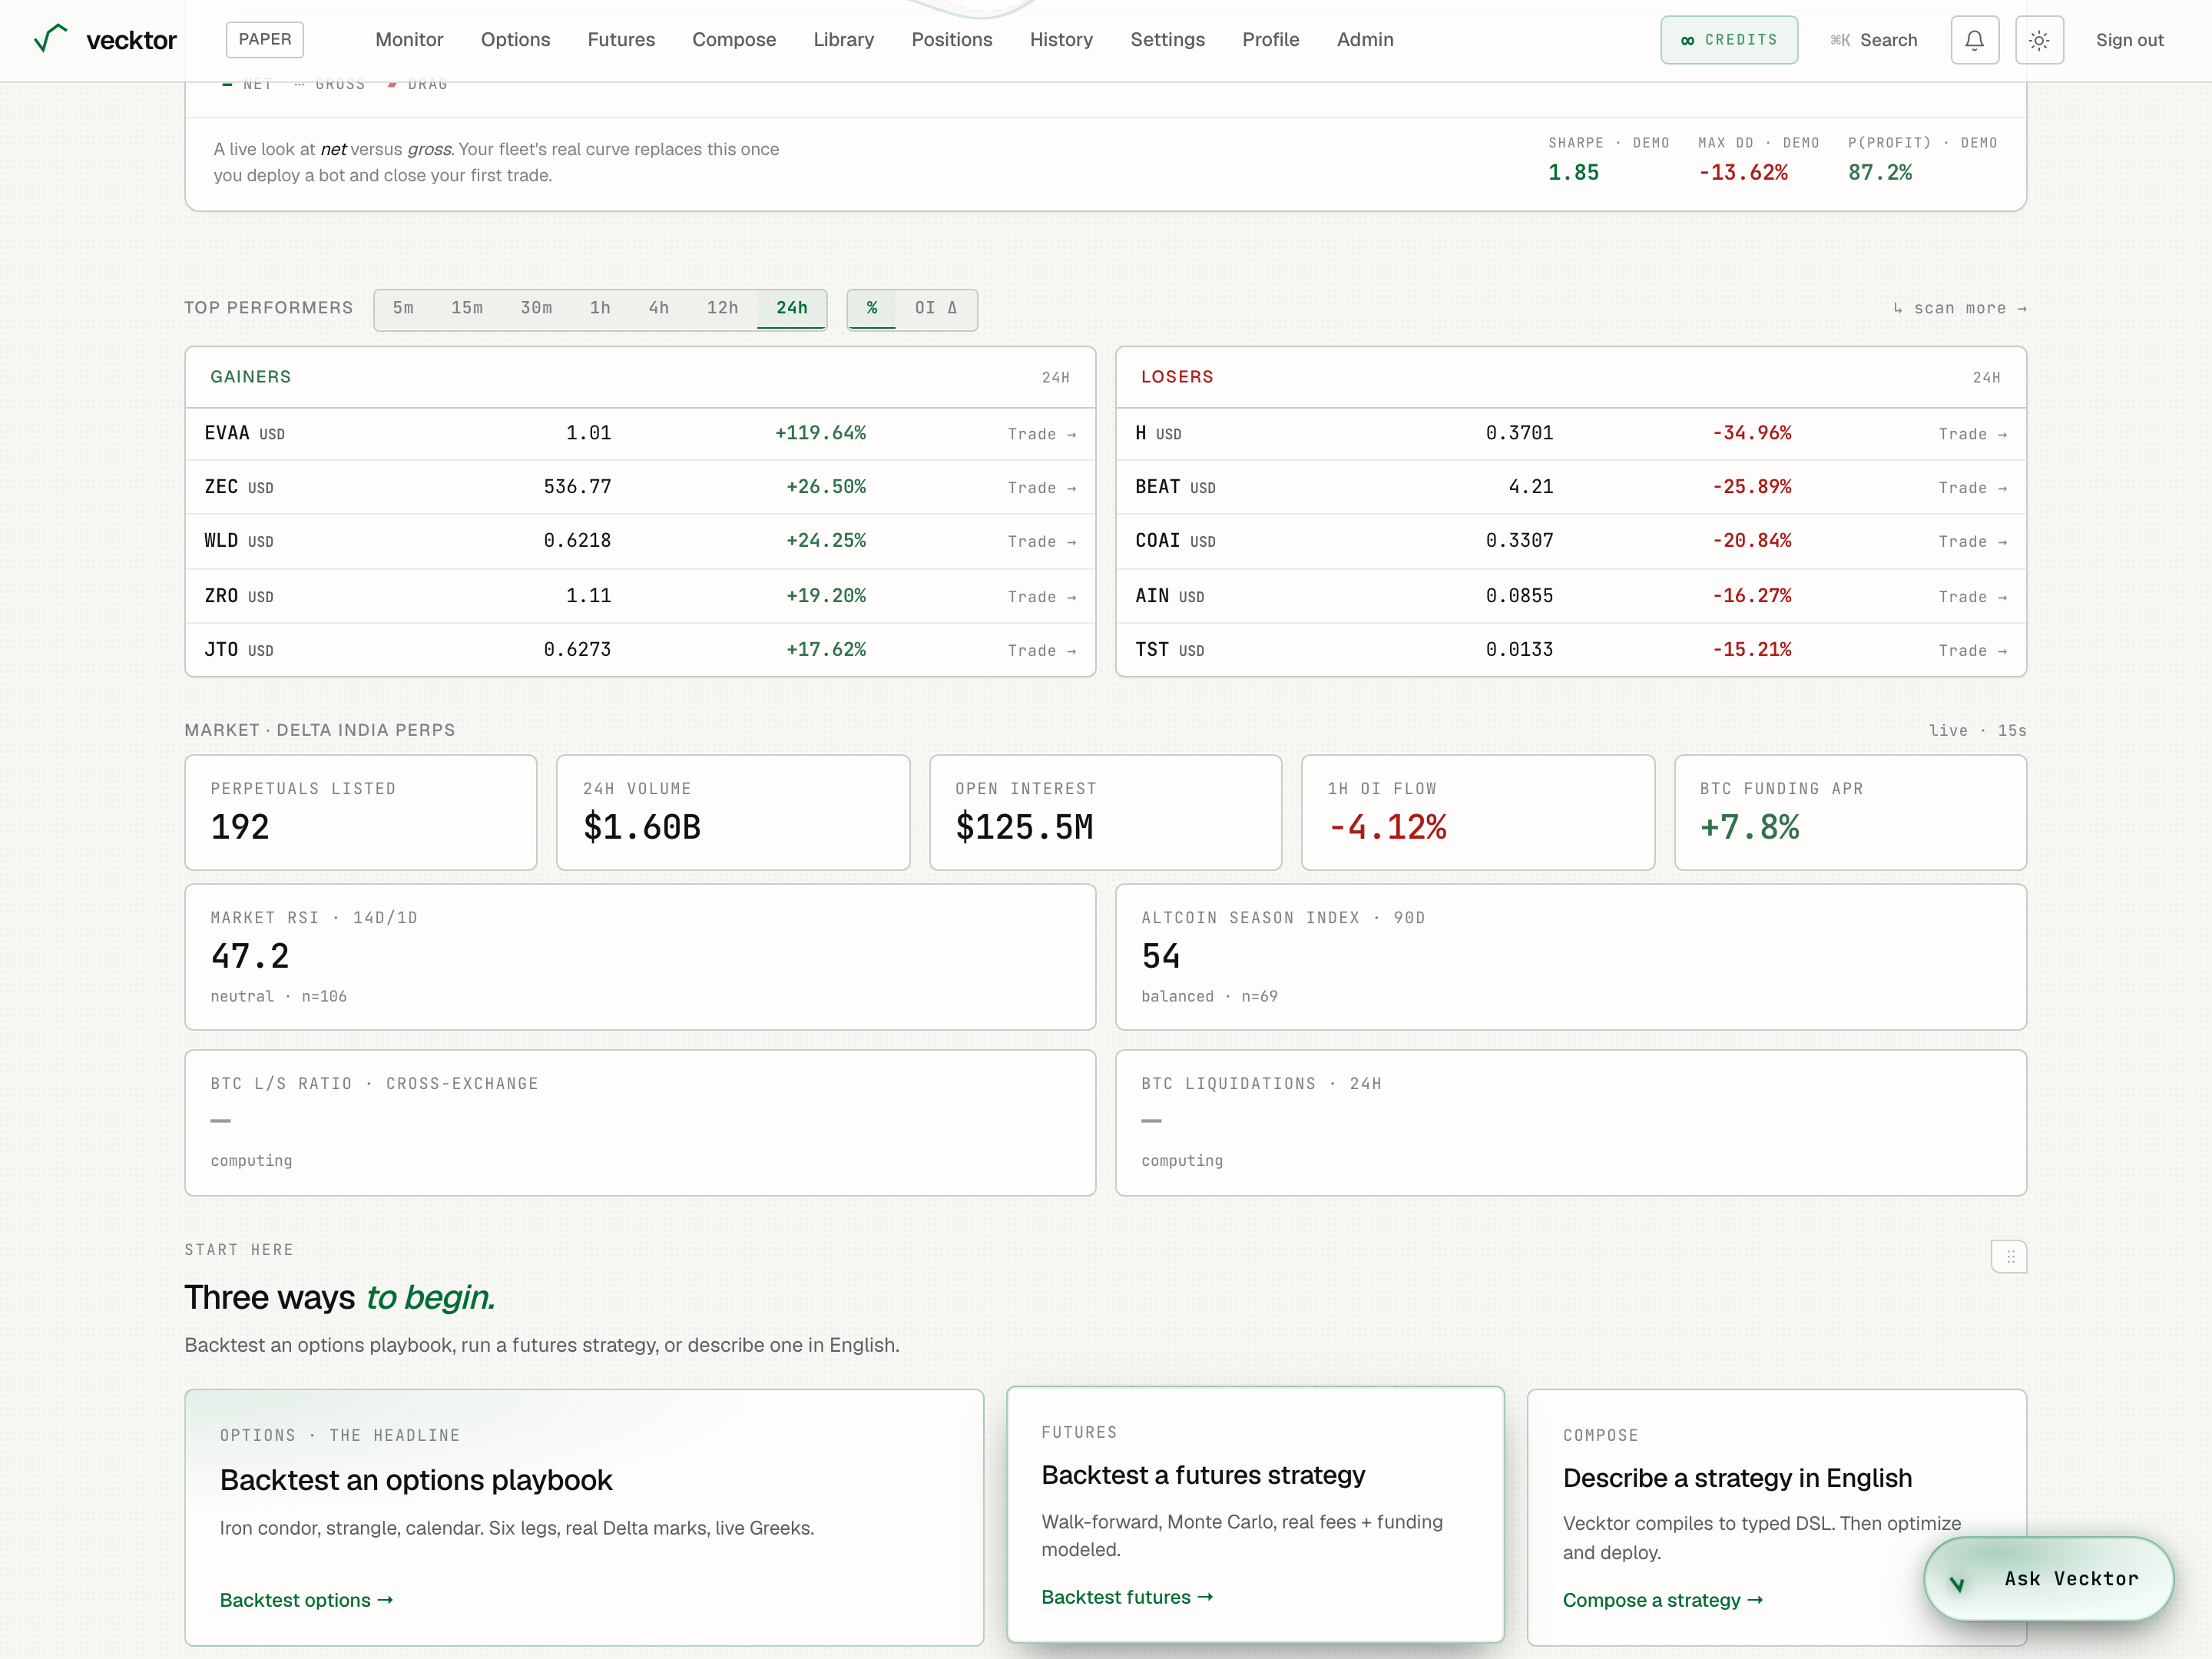
- Pick a time window
- Rank by price change (or OI Δ for open interest)
- Read a mover row
- Click Trade (opens options for BTC/ETH, futures for others)
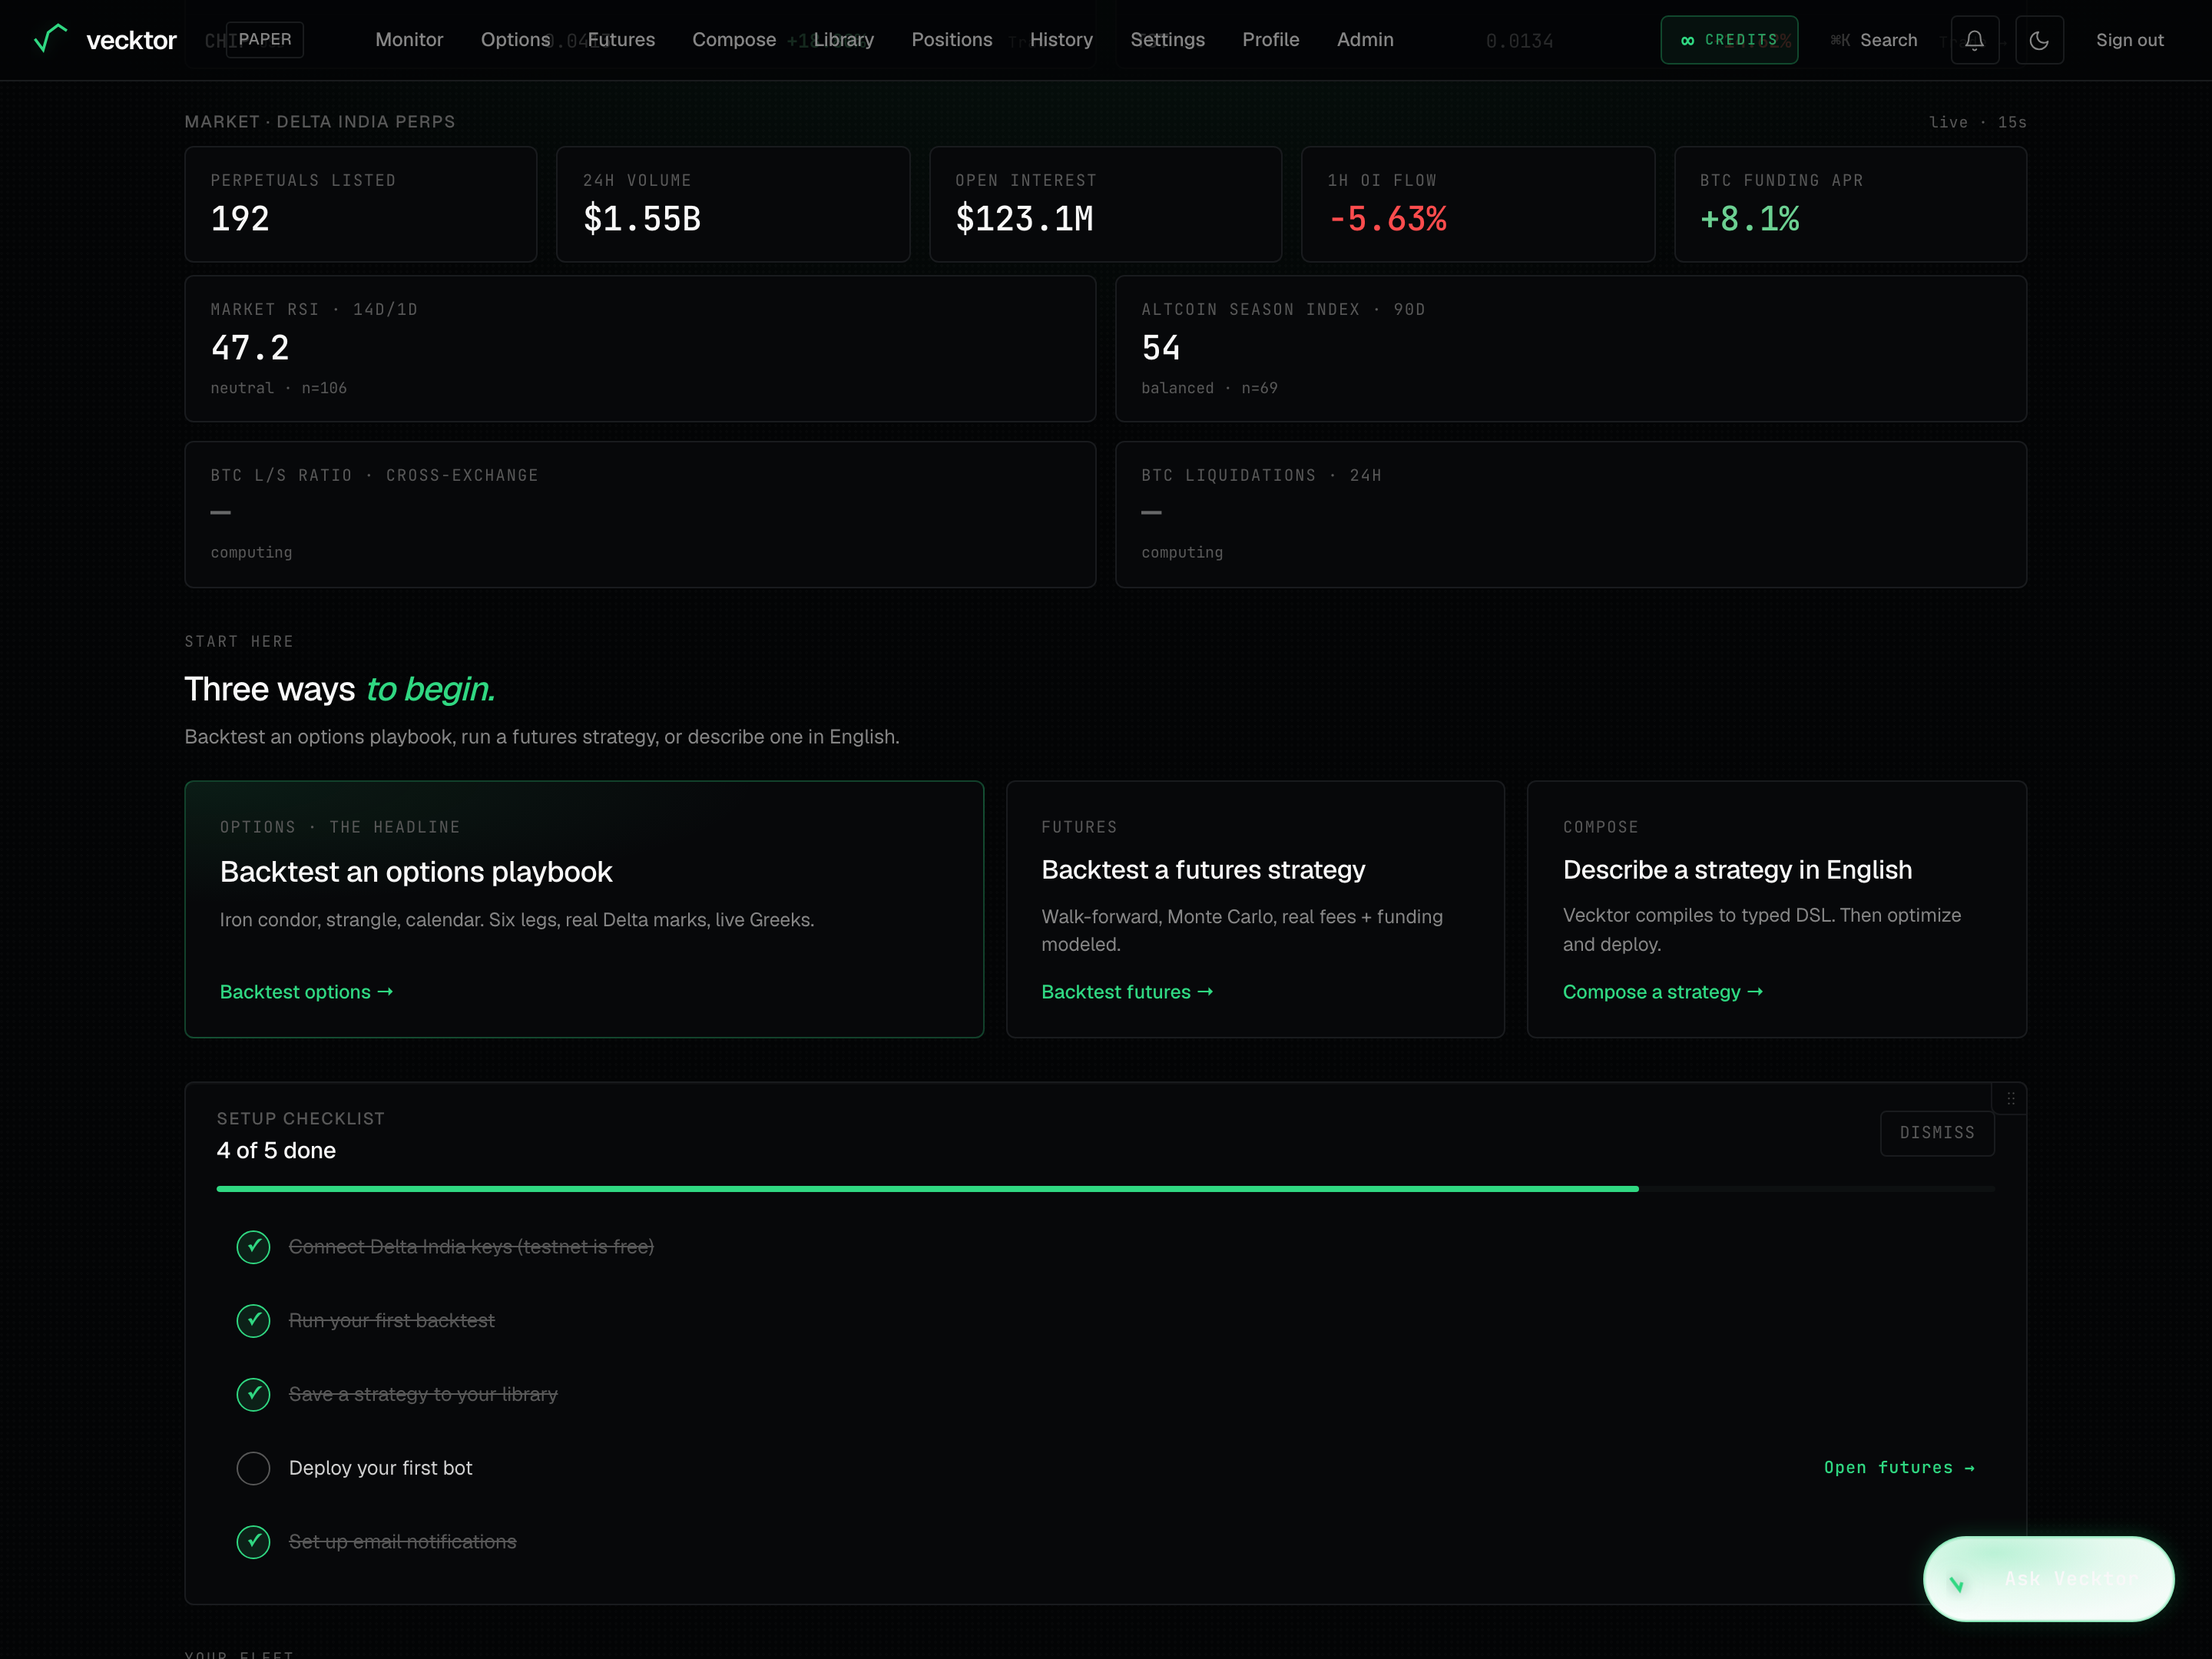
Market context strip
Below the movers is the Market · Delta India perps strip, a row of market tiles for the perpetuals (perpetual futures, contracts with no expiry) listed on Delta India. Its header reads live · 15s and it refreshes every 15 seconds.
- Read Perpetuals listed: how many perpetual contracts are tracked.
- Read 24h volume: total traded value across those contracts in the last day.
- Read Open interest: the total dollar size of open positions.
- Read 1h OI flow: how open interest changed in the last hour, as a percent. Green is money coming in, red is money leaving.
- Read BTC funding APR: the annualised funding rate on BTC. Positive means longs pay shorts.
 1Open interest21h OI flow3Funding APR
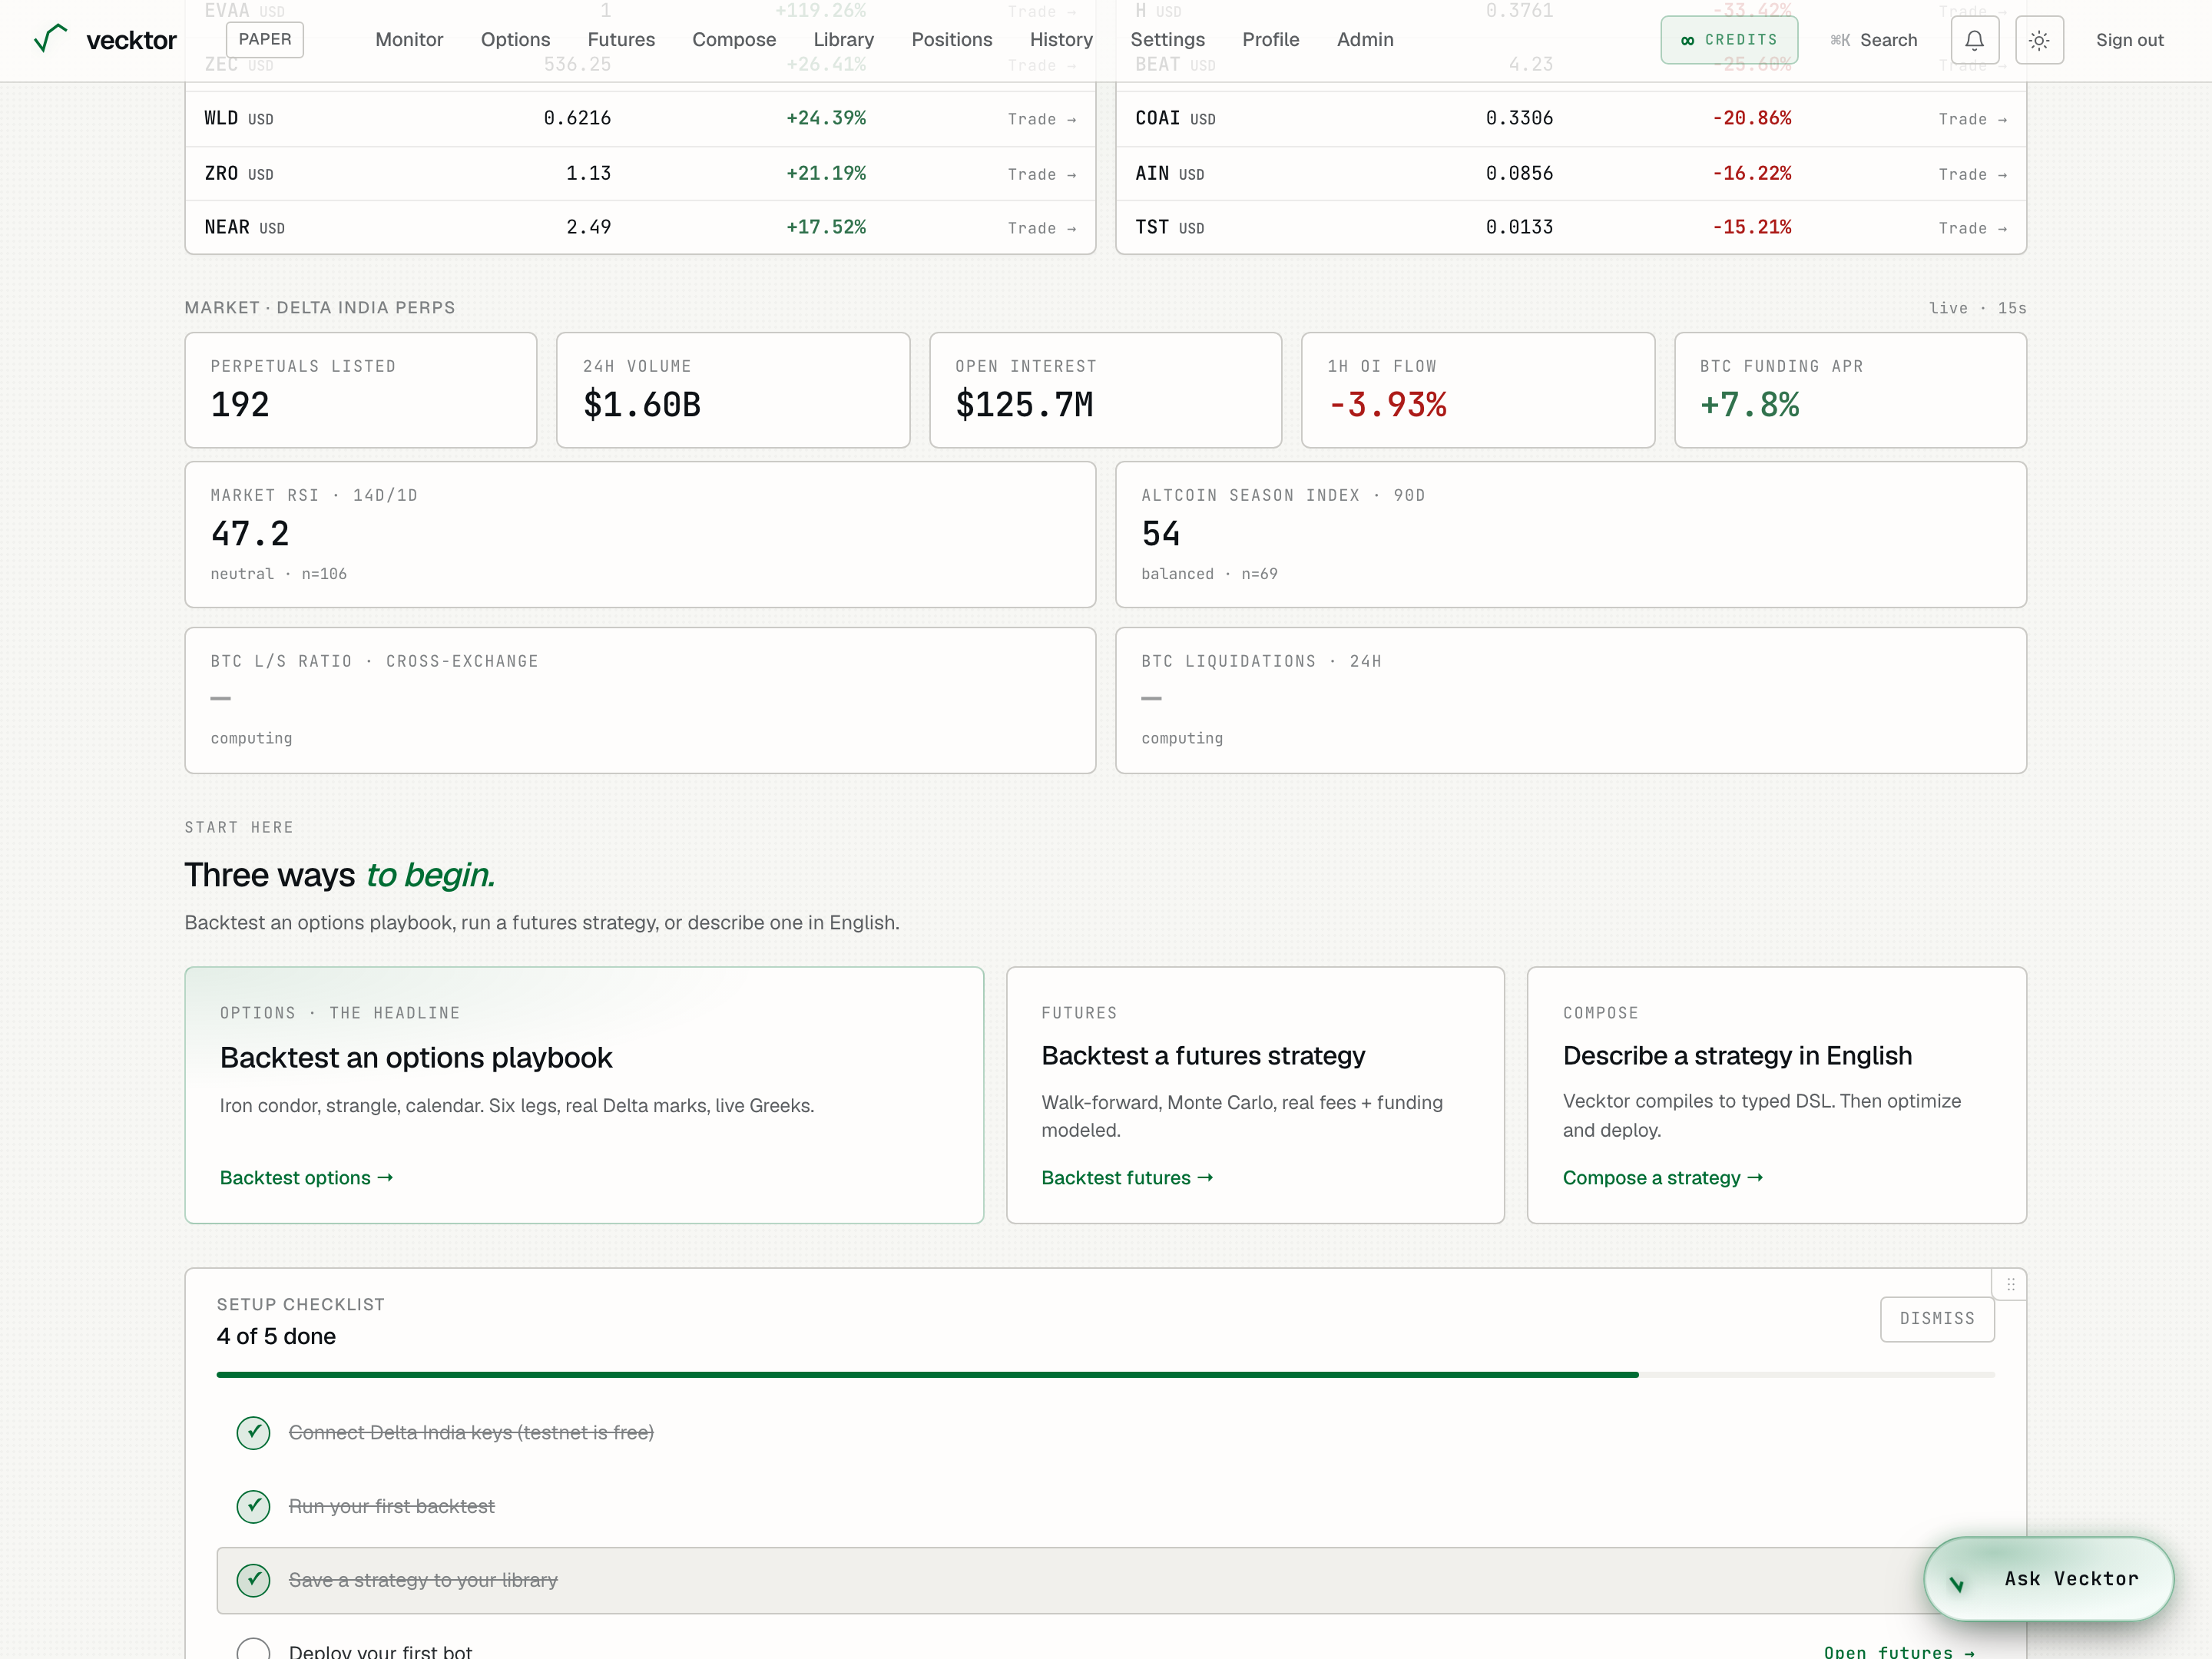
RSI, Altcoin Season, and cross-exchange sentiment
Two more rows sit under the market strip. The first is medium-term market posture. The second is cross-exchange sentiment for BTC.
- Read Market RSI · 14d/1d: the average 14-period RSI on daily closes across the top perps. RSI (relative strength index) runs 0 to 100. Above 70 reads overbought, below 30 reads oversold.
- Read Altcoin Season Index · 90d: above 75 reads altcoin season, below 25 reads bitcoin season, in between reads balanced.
- Note the n= count under each tile. That is how many coins went into the number.
- Read BTC L/S Ratio · cross-exchange: the cross-exchange long-to-short ratio. Above 1 means more longs. The chips below show each venue.
- Read BTC Liquidations · 24h: the total value of positions force-closed in the last day, split into longs and shorts.
 1Market RSI2Altcoin Season
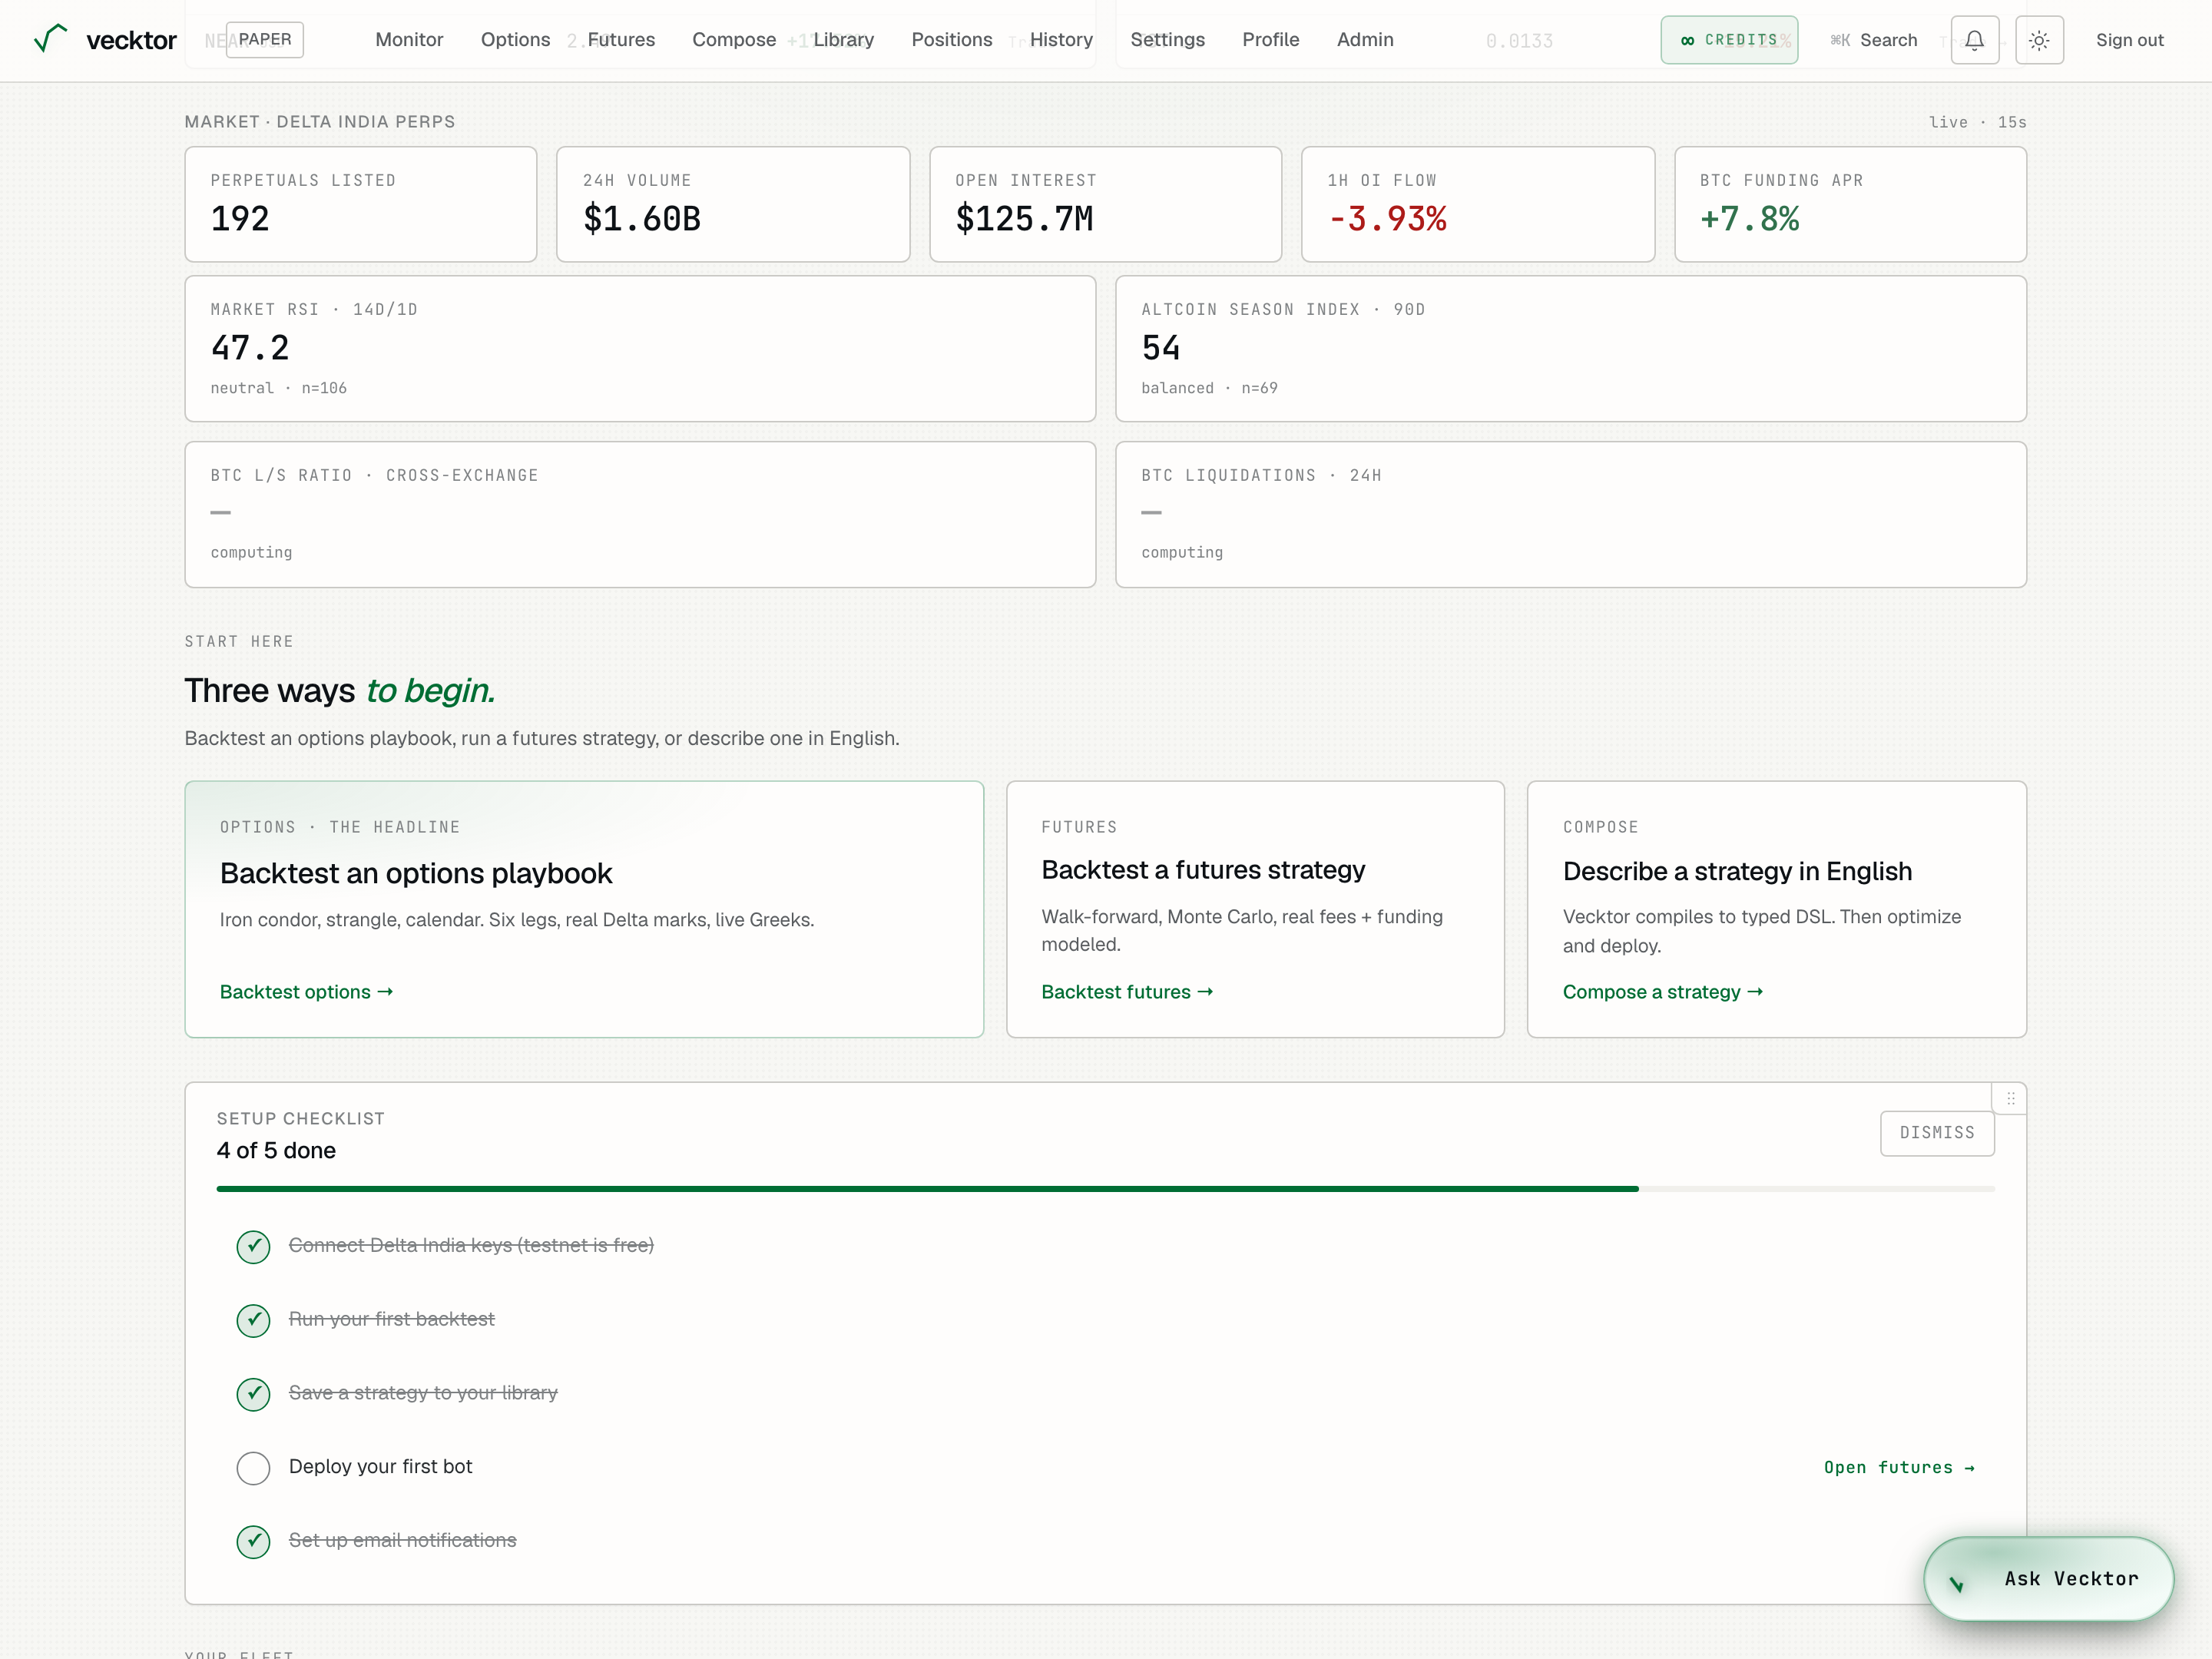
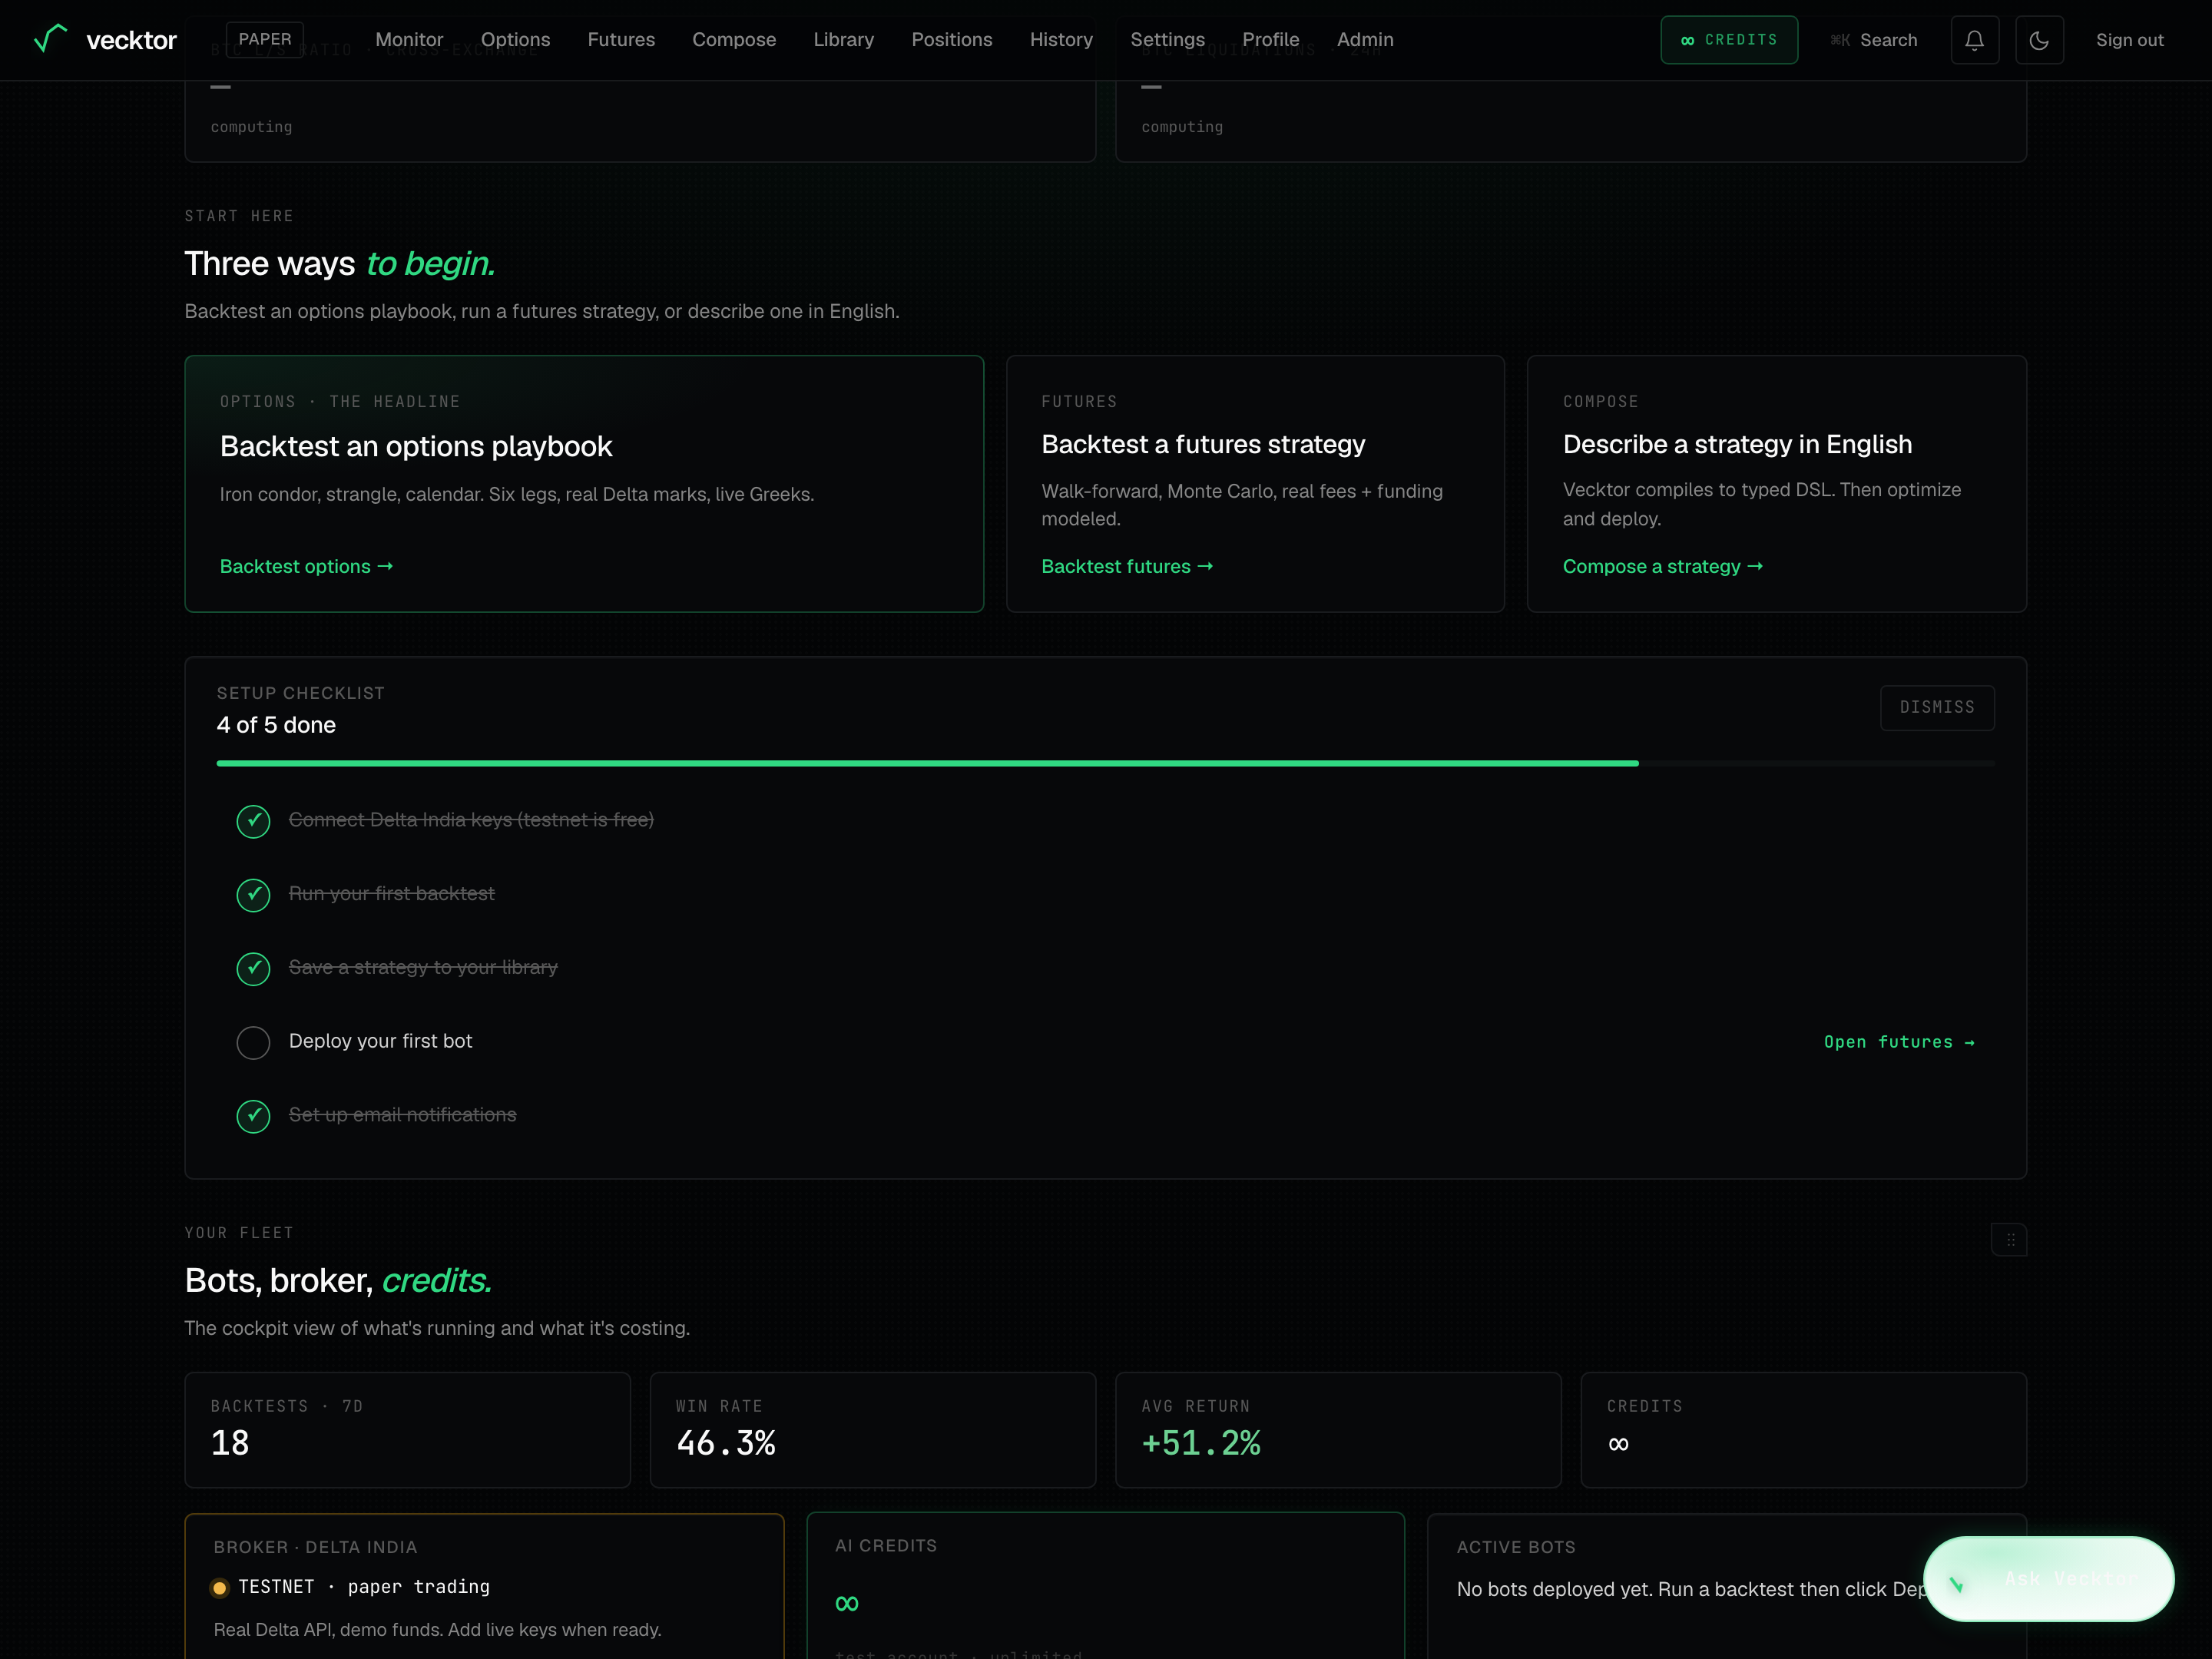
Three ways to begin
The Start here block offers three tiles, each opening a different way to build a strategy.
- Click Backtest an options playbook to open the options page and test a multi-leg structure on real Delta marks.
- Click Backtest a futures strategy to open the futures page with walk-forward and Monte Carlo tools.
- Click Describe a strategy in English to open Compose, where you type a strategy in plain words and Vecktor turns it into a runnable one.
 1Options2Futures3Compose
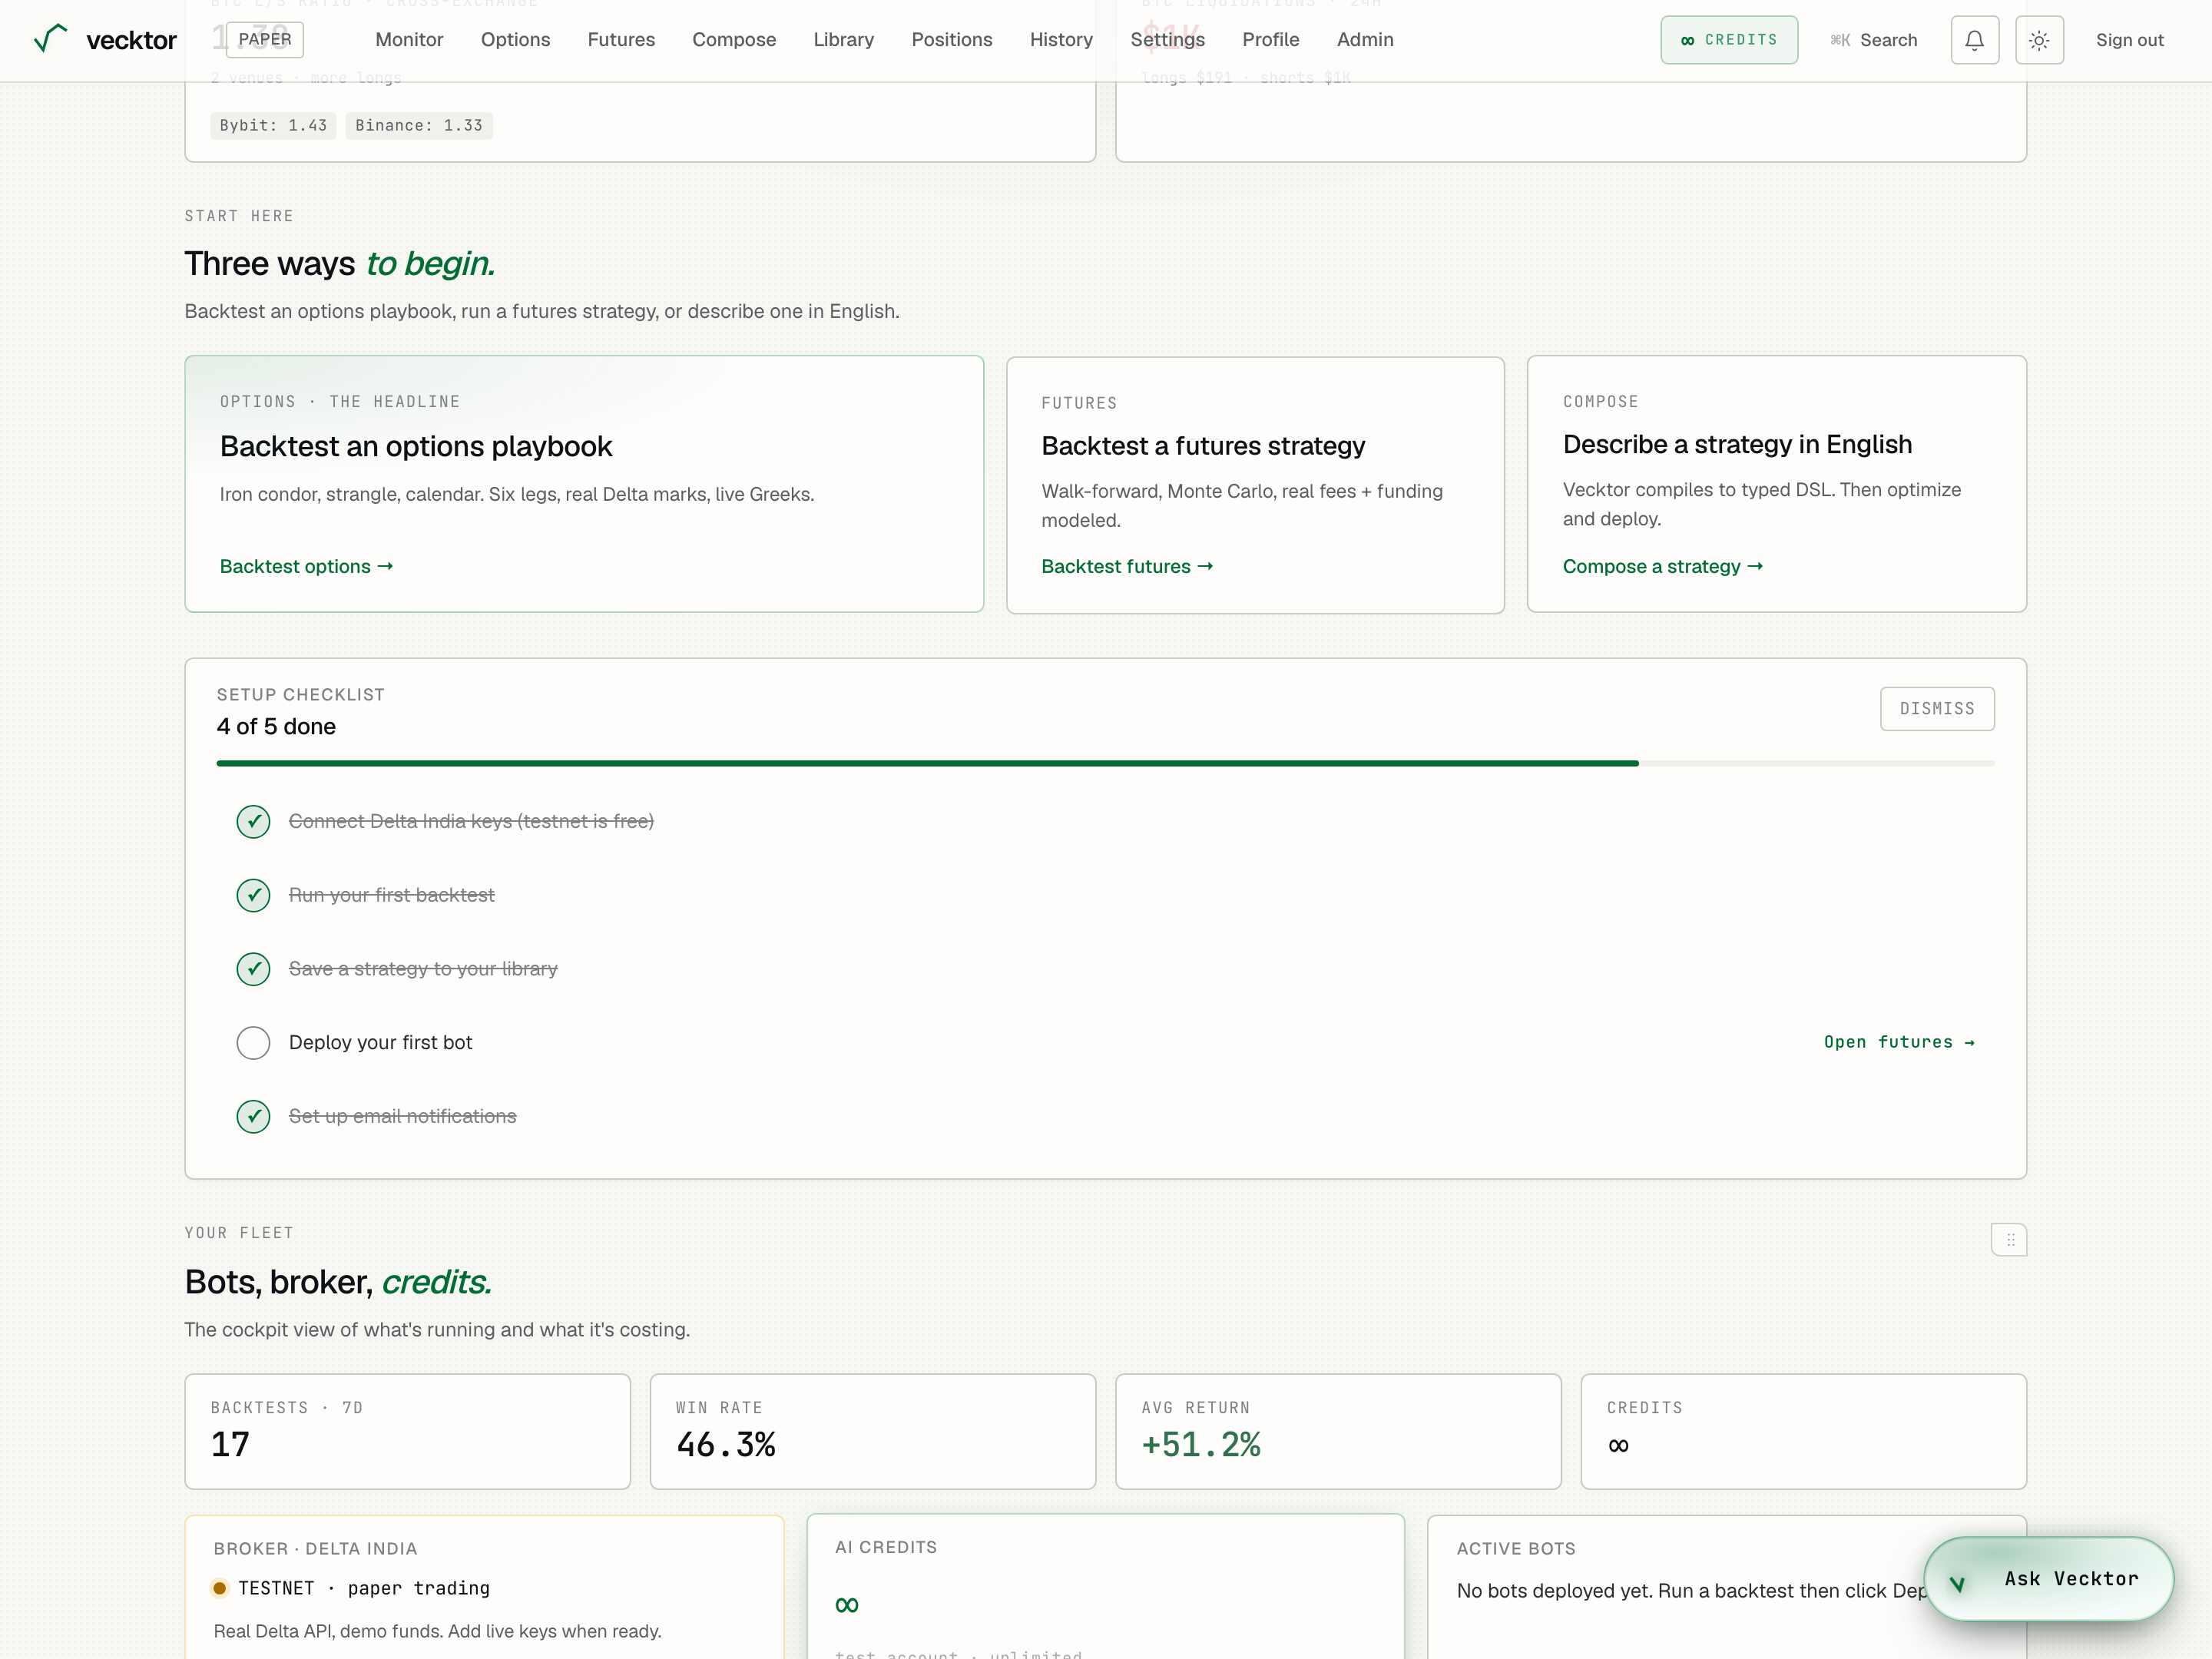
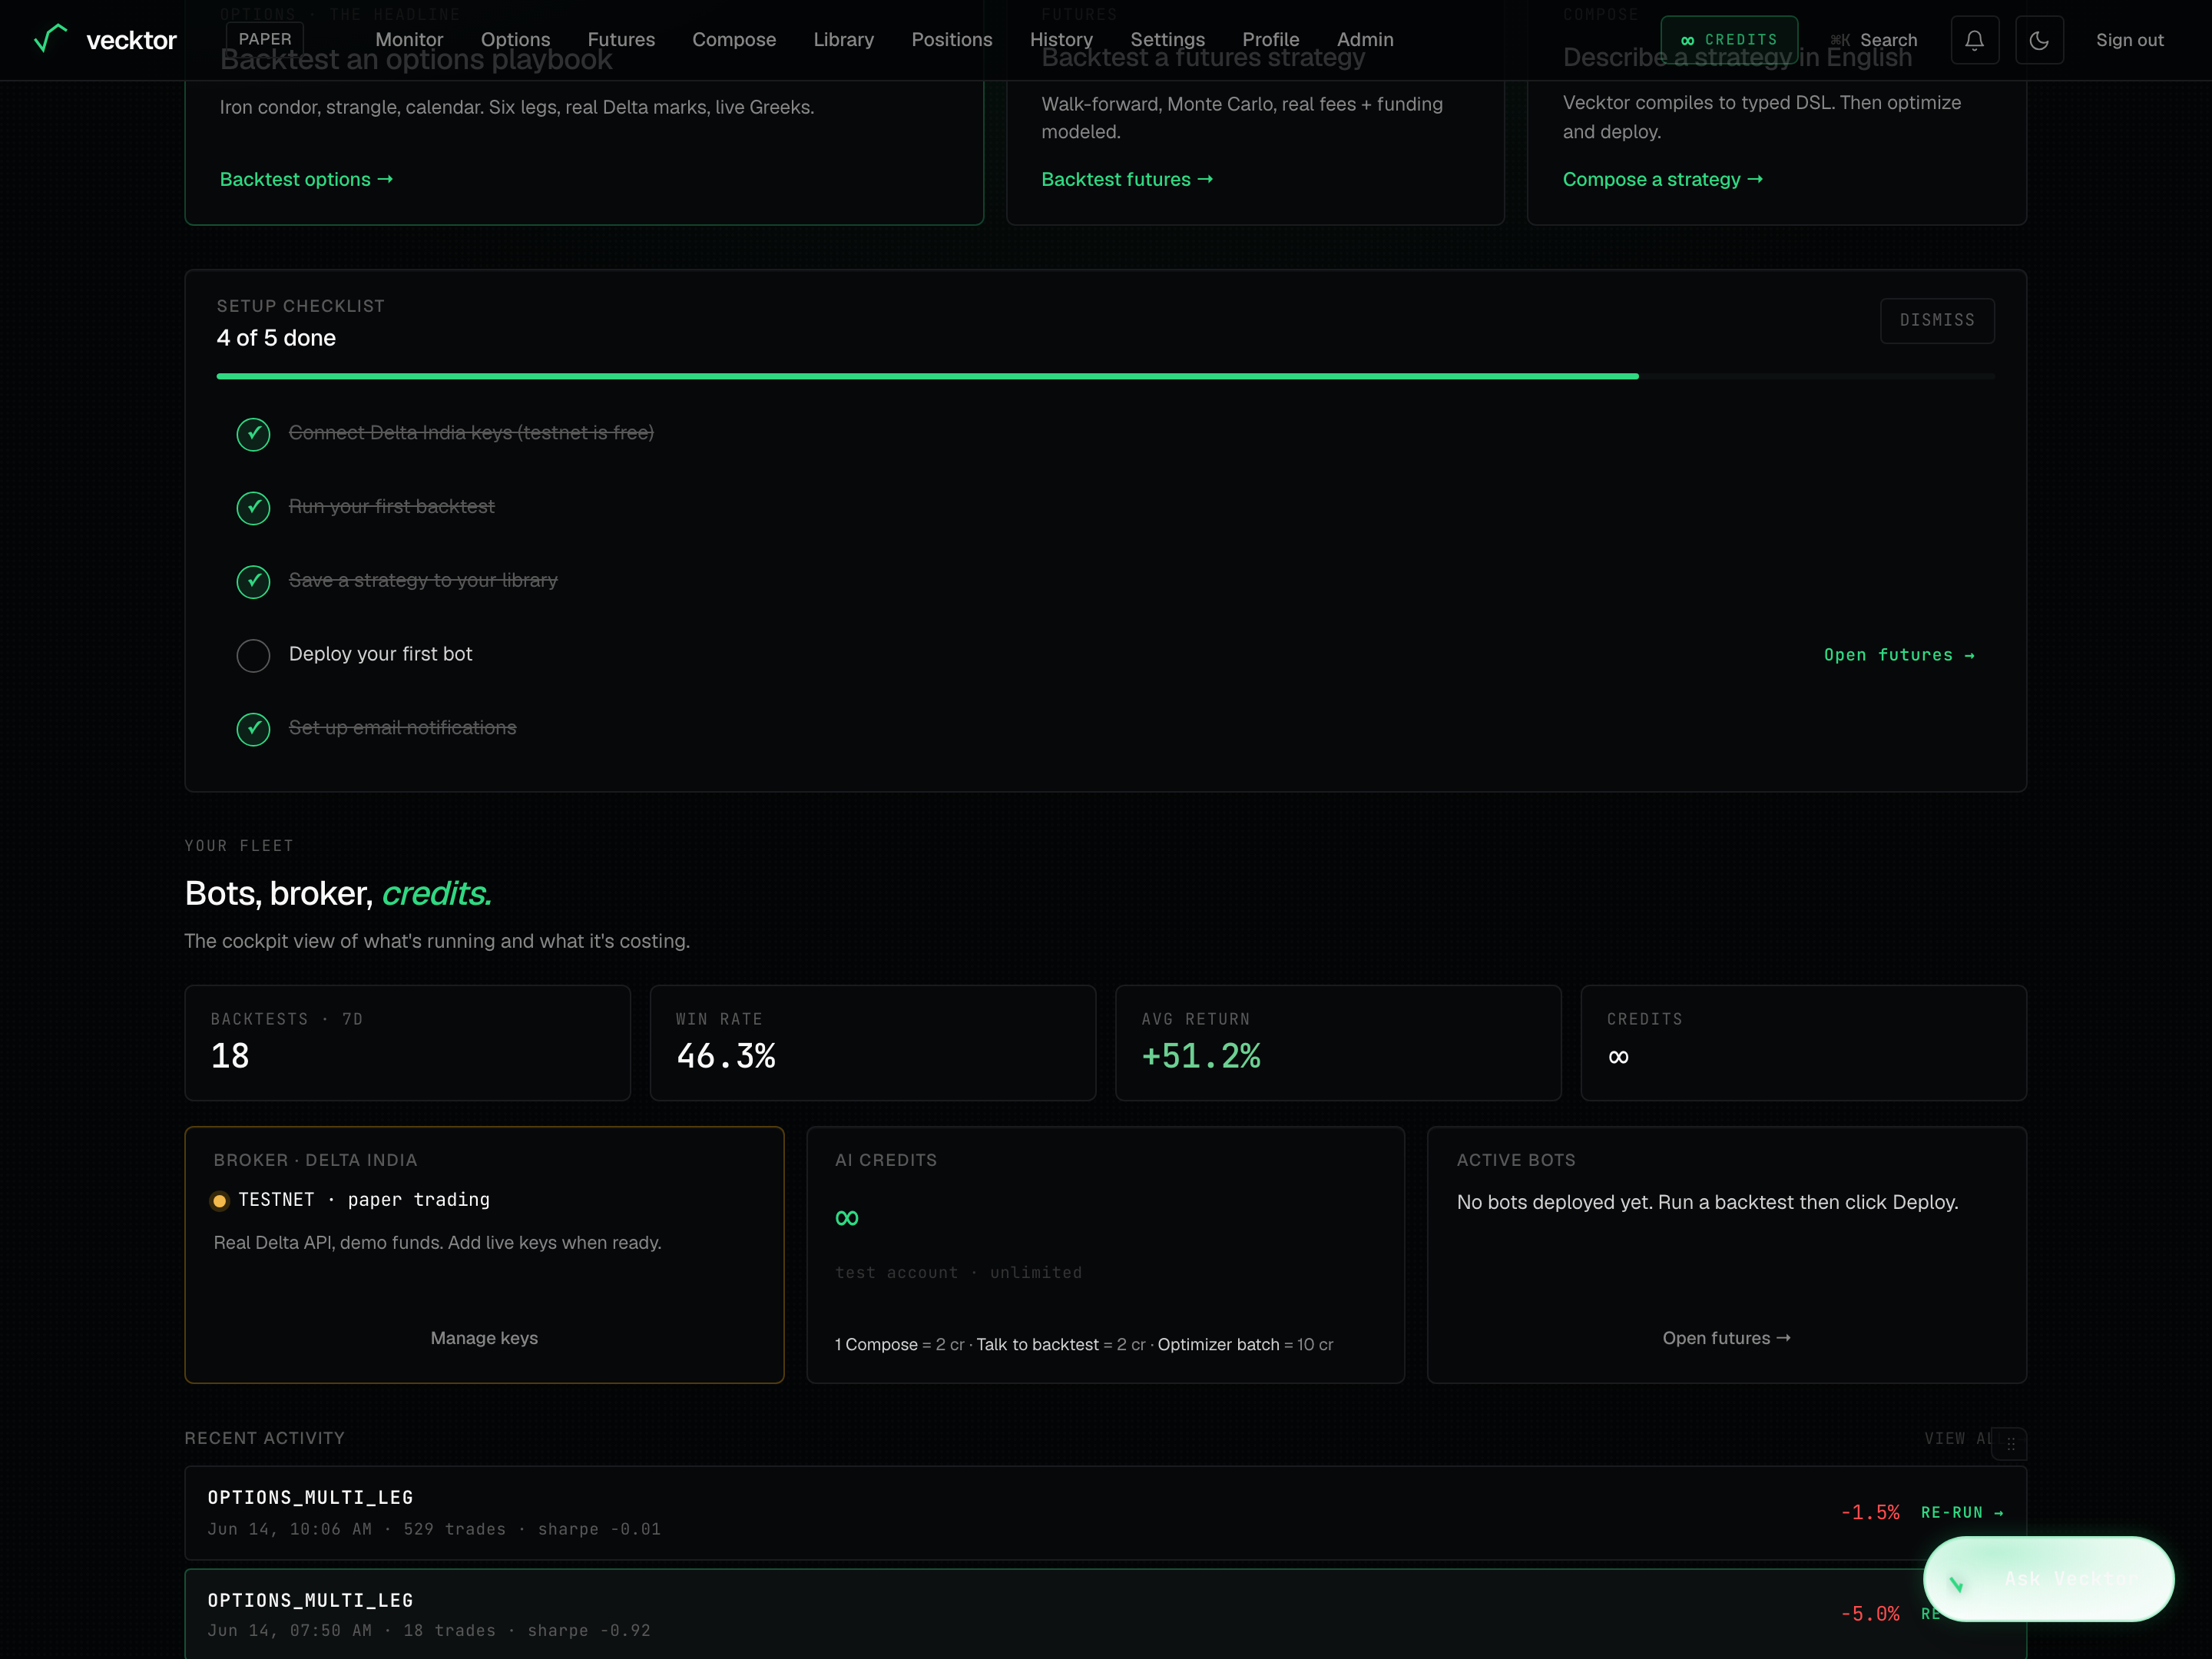
The setup checklist
The Setup checklist tracks five steps to get fully set up. Each step ticks itself when the real thing is done. There is no manual mark as done.
- Read the count at the top: how many of five are done.
- Click a row to go straight to that step. The five rows are Connect Delta India keys, Run your first backtest, Save a strategy to your library, Deploy your first bot, and Set up email notifications.
- Watch a row tick automatically once you complete it.
- Click Dismiss to hide the checklist if you do not want it.
 1Five steps, auto-tick2Click a row to start it
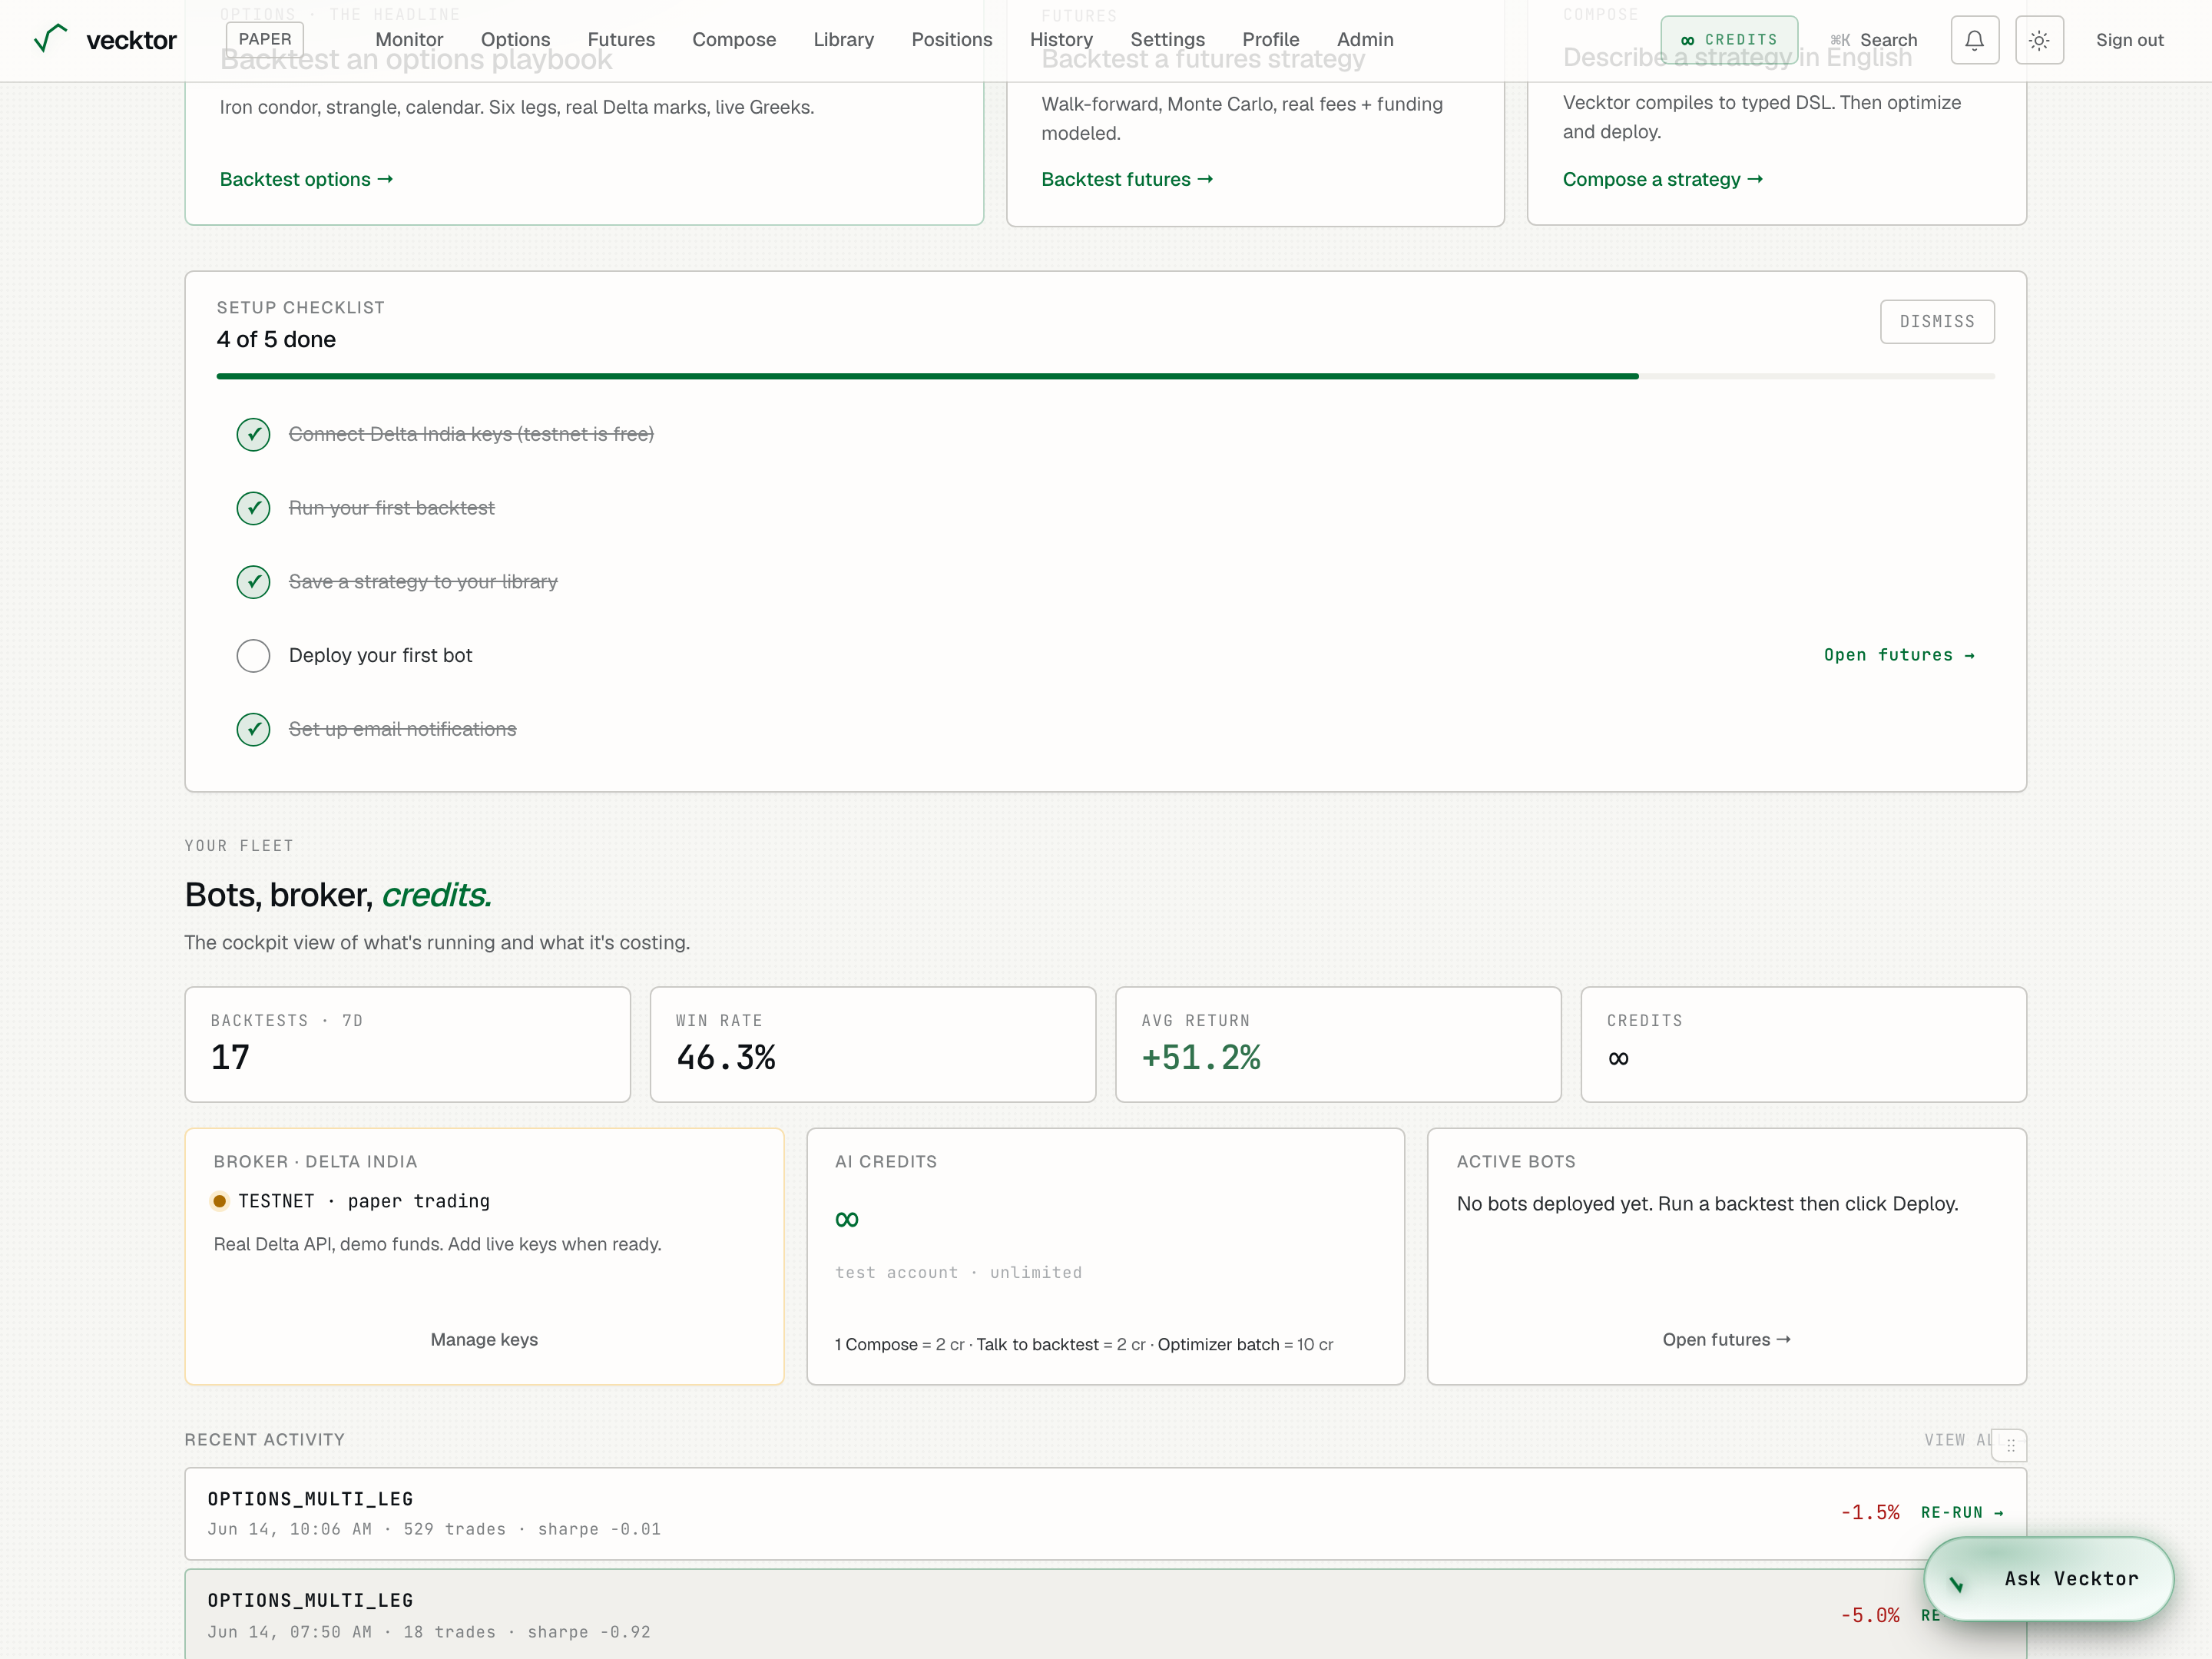
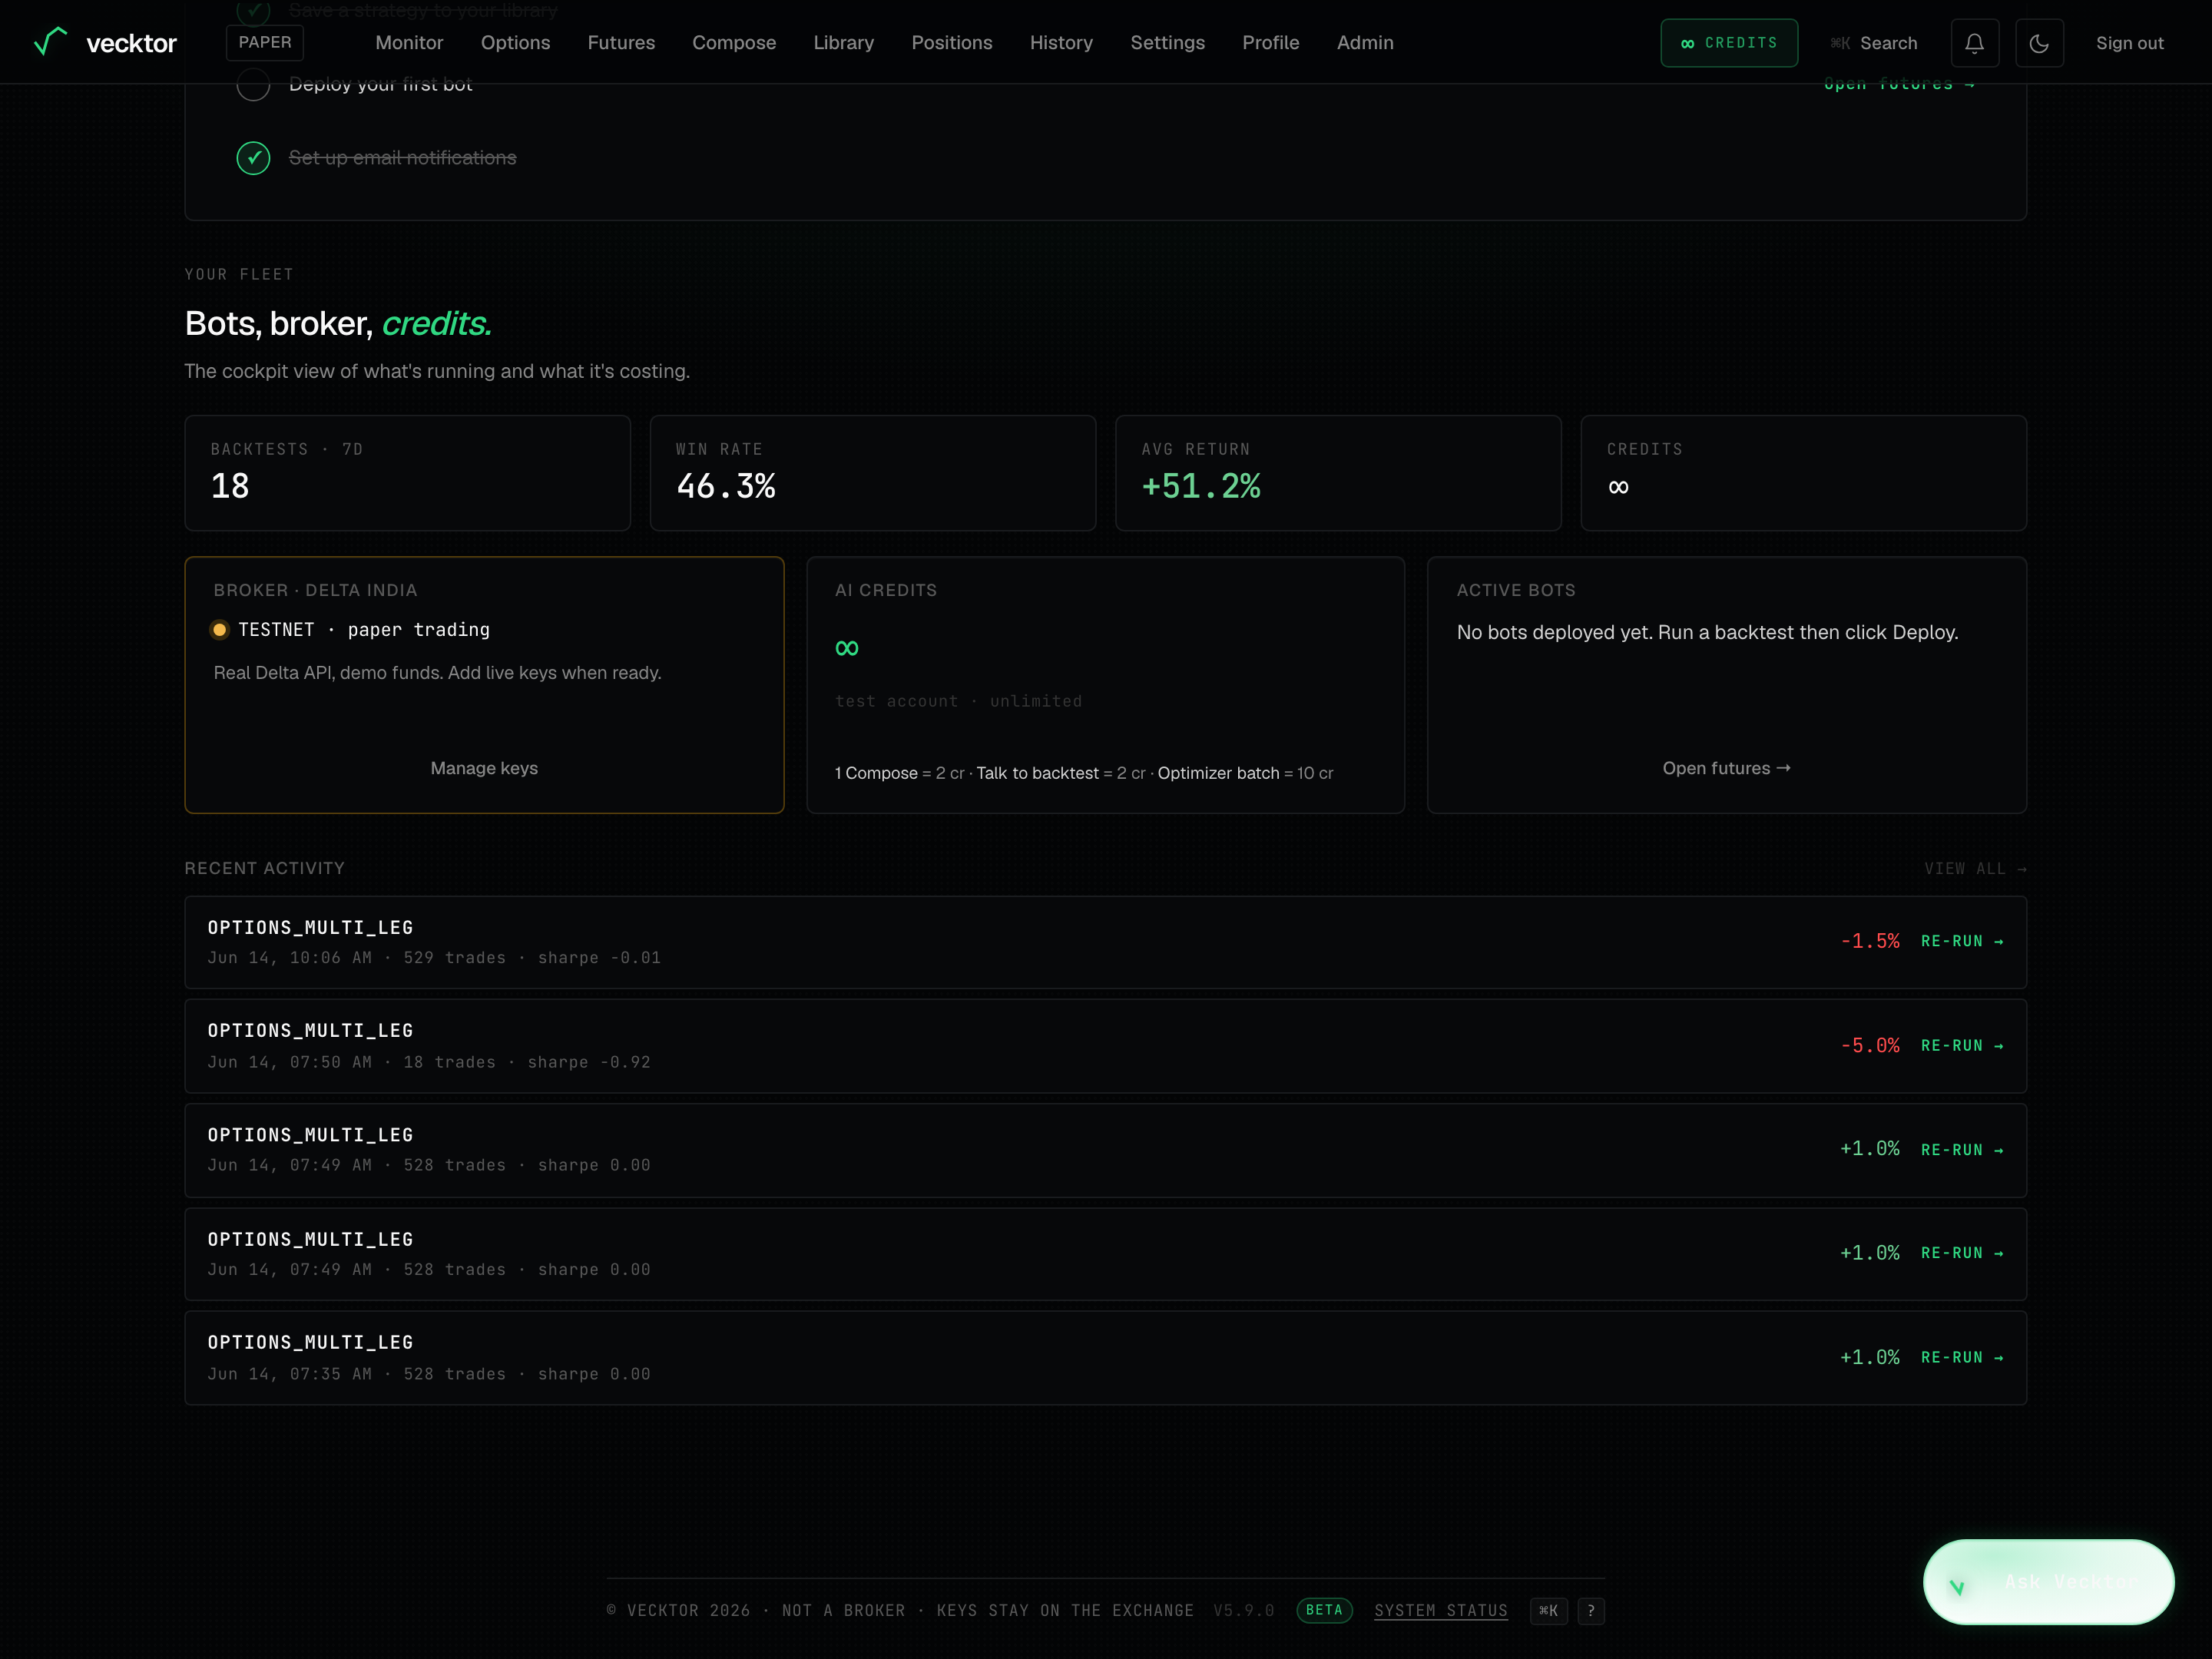
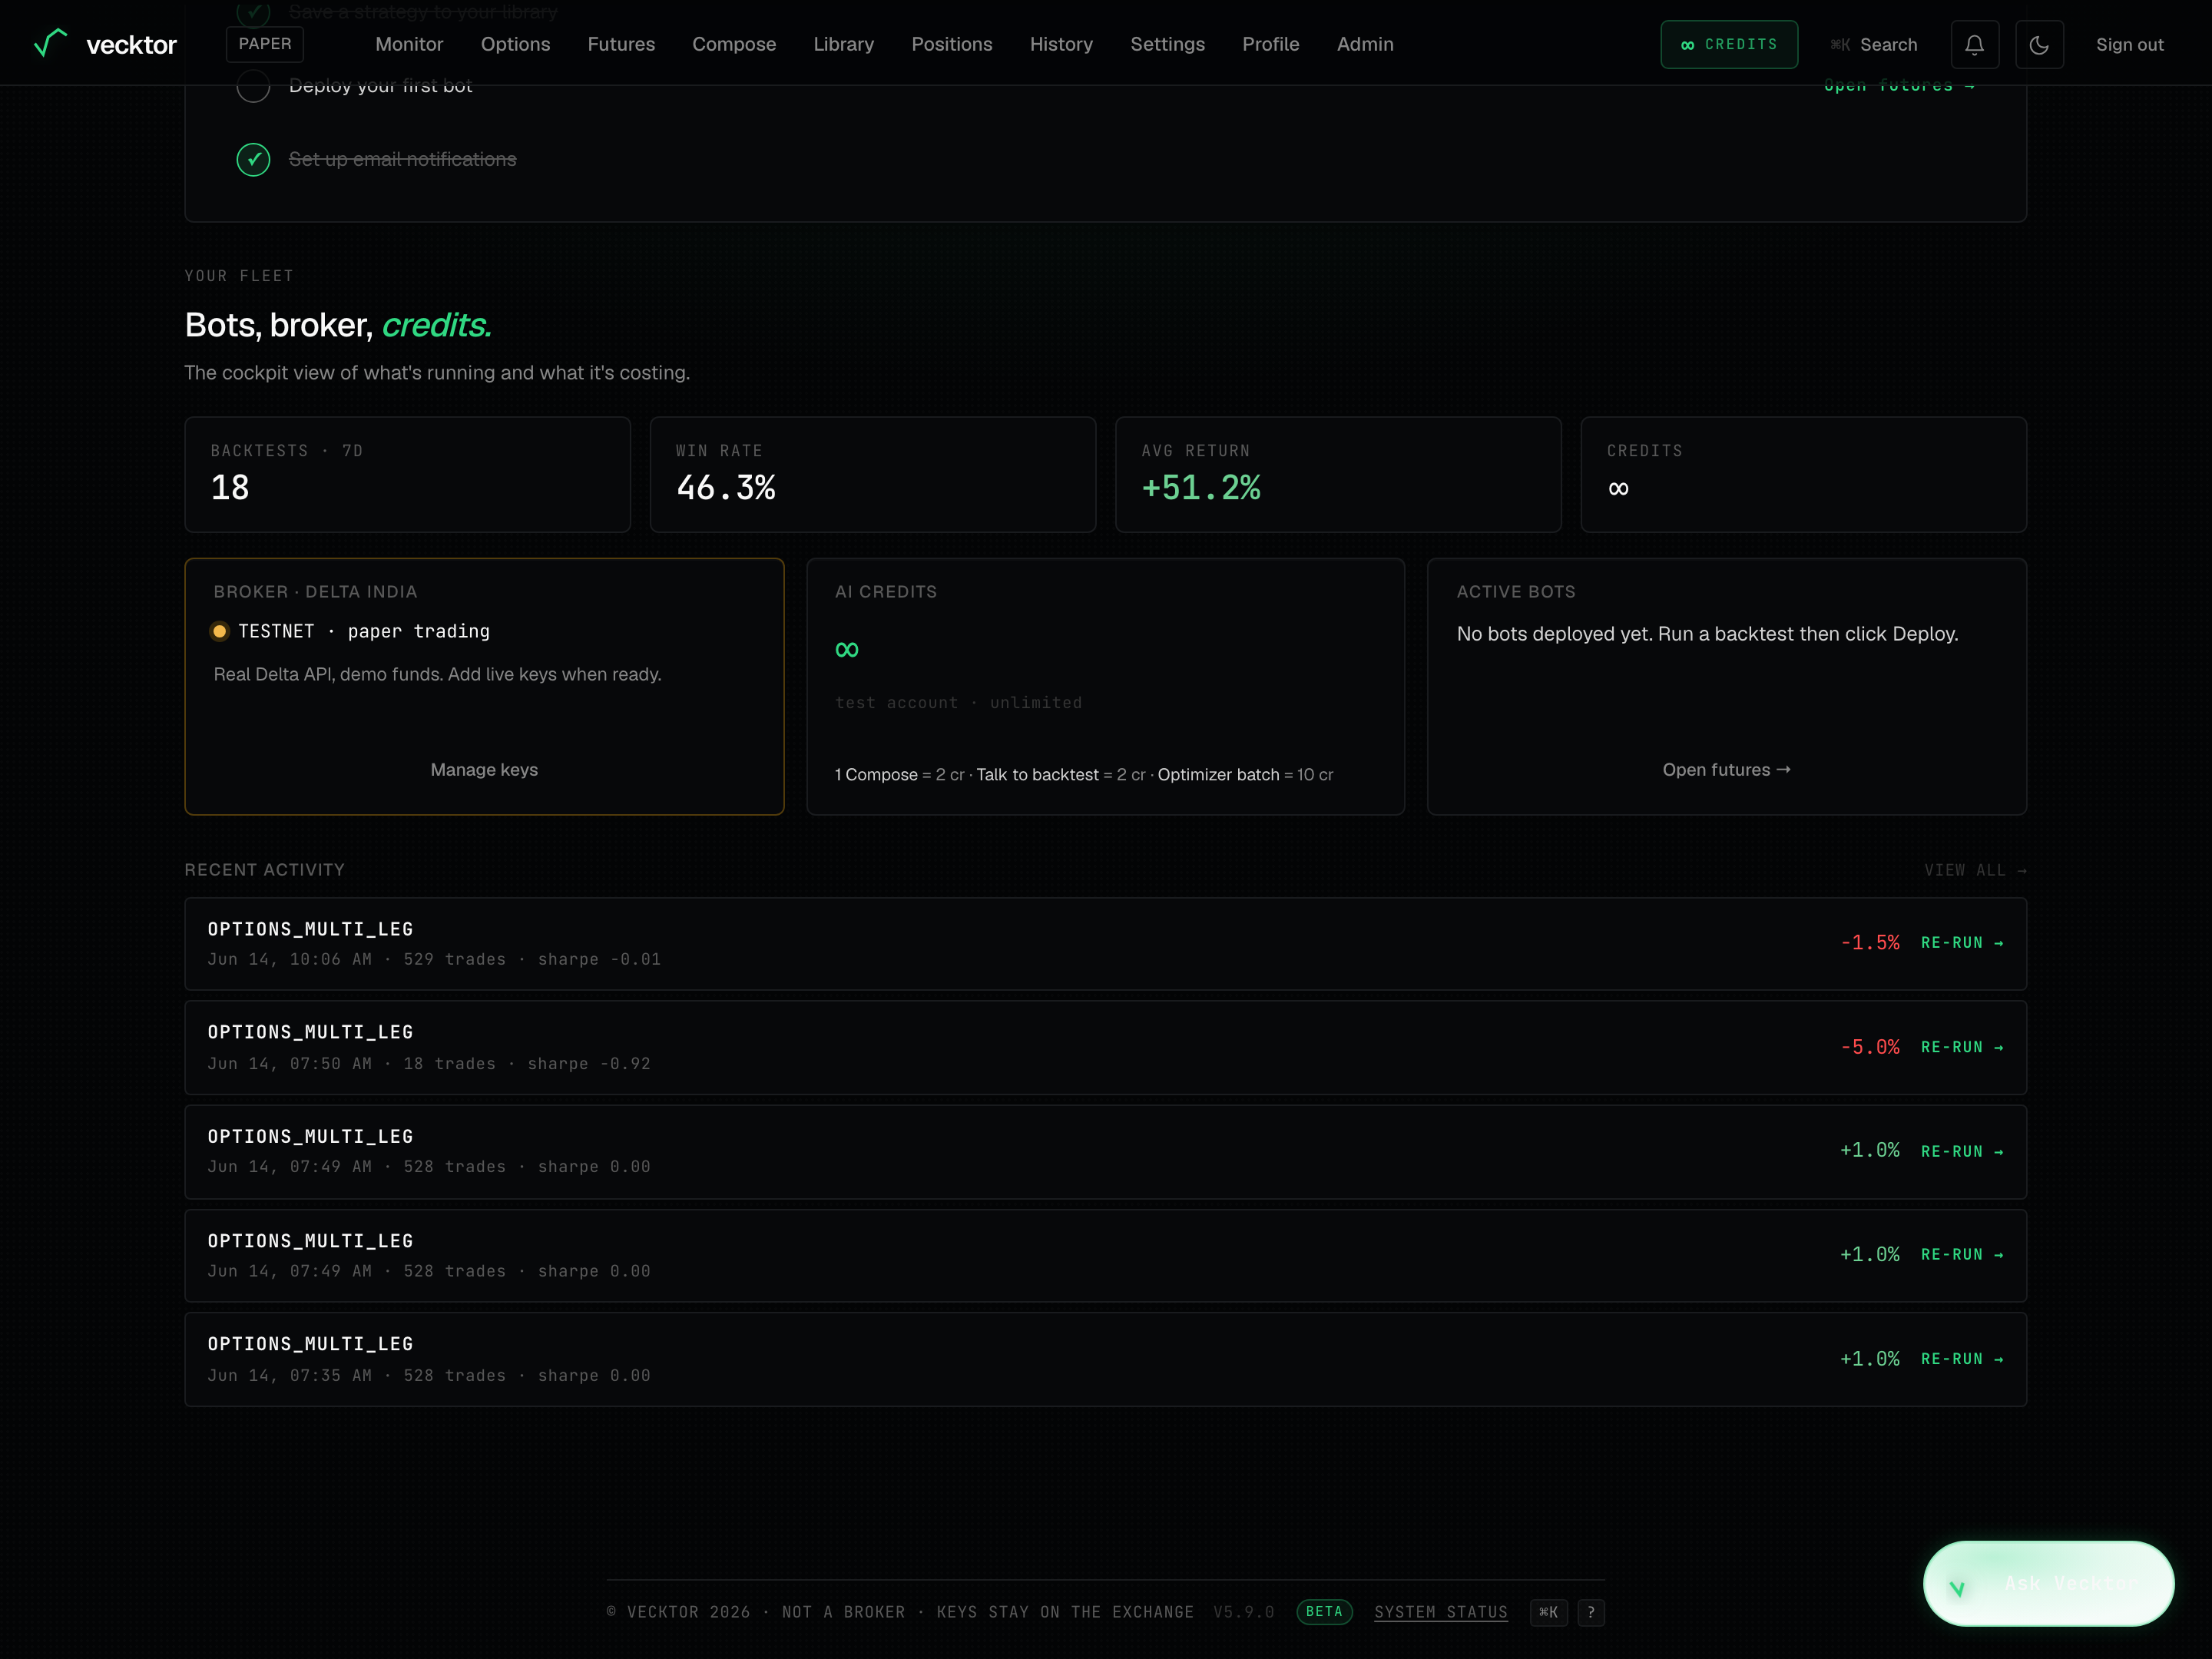
Your fleet: KPIs, broker, credits, bots
The Your fleet block is the cockpit view of what is running and what it is costing. It holds a row of personal numbers and three cards.
- Read the KPI strip: Backtests · 7d (runs in the last 7 days), Win rate (averaged across recent runs), Avg return, and Credits (your balance). These are summaries of your own activity, not portfolio equity.
- Read the Broker · Delta India card. It shows whether your live keys are connected. Click Connect Delta or Manage keys to change it.
- Read the AI credits card. It shows your balance, a bar against the monthly free grant, and what each AI action costs.
- Read the Active bots card. It shows how many bots are running, paused, and total. Click Open positions to manage them.
 1Broker mode2Credit balance3Running bots
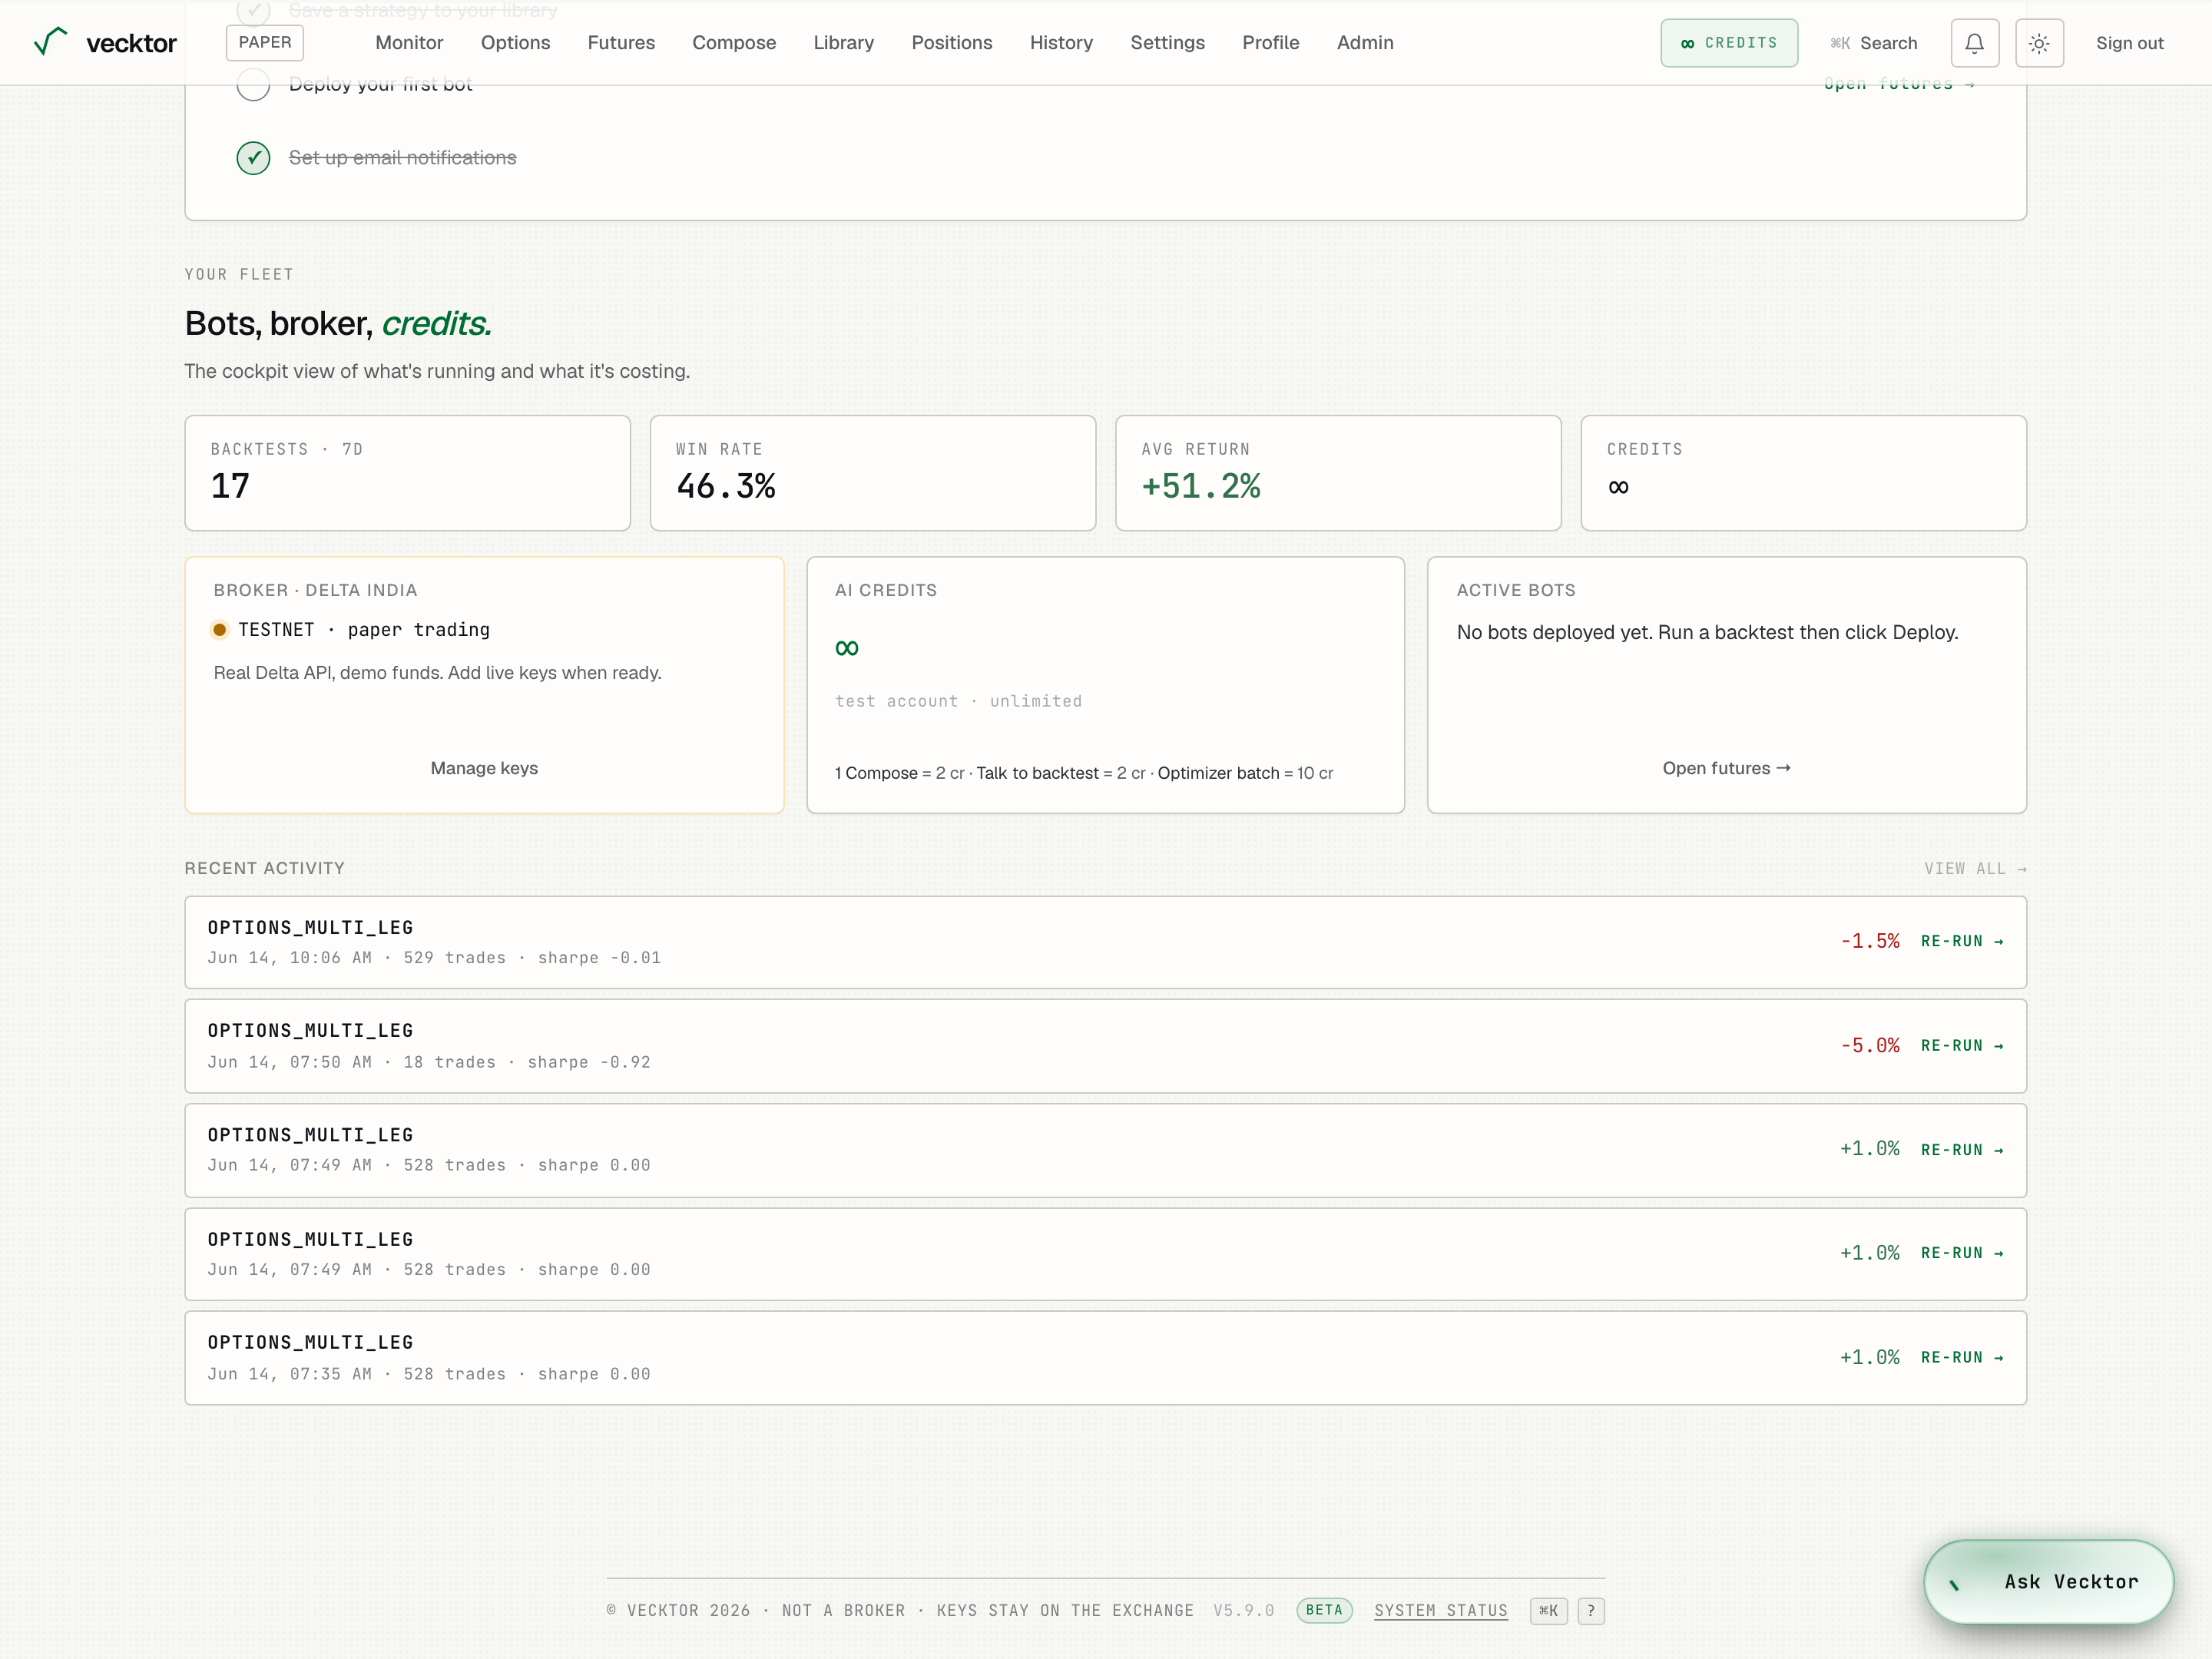
- Read your win rate (a summary of your runs, not equity)
- Check your keys (orders execute live on your Delta account)
- Read your credit balance (AI actions spend these)
- Read running bots (Open positions to manage them)
Recent activity
The Recent activity rail lists your last five backtests so you can jump back into any of them.
- Read each row: the strategy name, the date and time, the number of trades, and the Sharpe.
- Read the return chip on the right. Green is positive, red is negative.
- Click a row, or its Re-run arrow, to reopen that backtest on the futures page.
- Click View all to open your full history.
 1Your last five backtests2Open full history
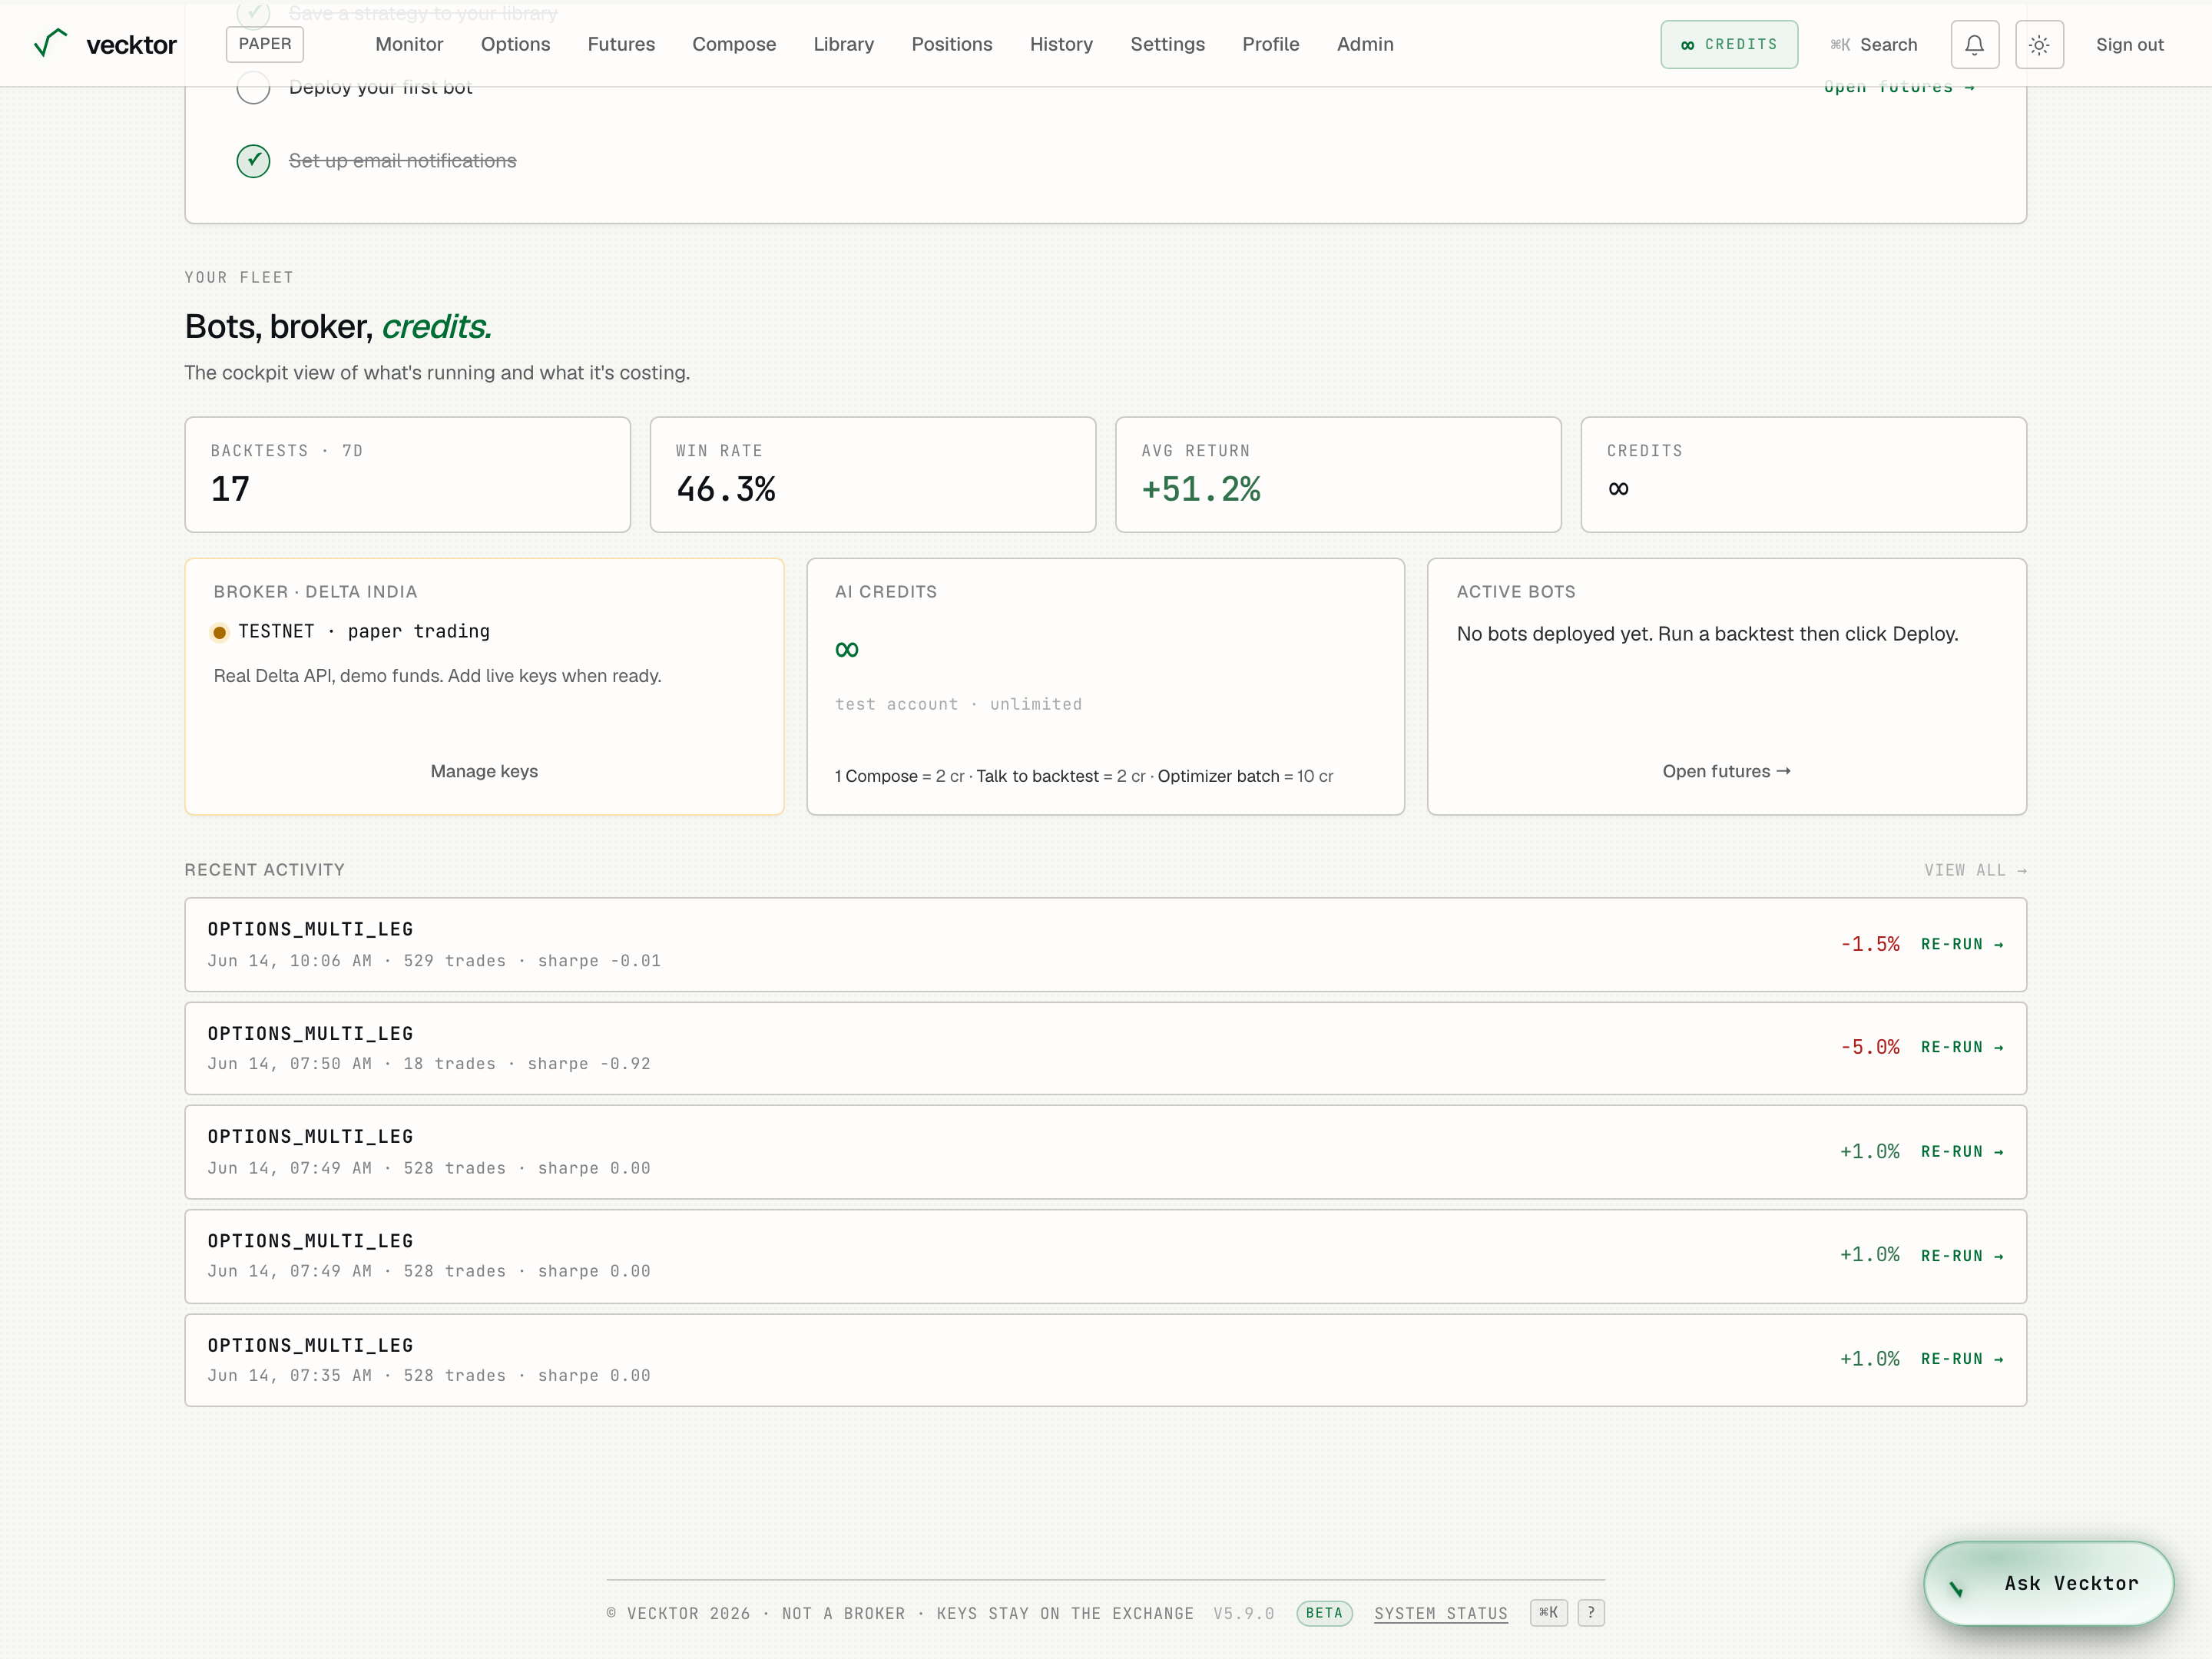
Reorder and reset sections
The four lower blocks (Start here, the setup checklist, Your fleet, and Recent activity) can be reordered. The top of the page (ticker, greeting, chart, wizard, movers, and market context) stays fixed.
- Find the grip handle at the corner of a lower block.
- Drag the block up or down to a new spot. The order saves to this browser.
- On a phone, press and hold the grip, then drag.
- Click Reset layout to put the blocks back in the default order. That link only appears once you have moved something.
- Grab a block by its grip
- Drop it in a new spot (saved to this browser)
- Click Reset layout (back to the default order)
The support dock
The Help pill sits in the corner of the page (a small button on mobile). It answers common questions and points you to the contact form for the rest.
- Click Help to open the dock.
- Click a suggested question, or type your own.
- Read the instant answer for common topics like fees, composing a strategy, or deploying a bot.
- Use the contact form for anything the dock cannot answer.
 1Open the support dock